the Creative Commons Attribution 4.0 License.

the Creative Commons Attribution 4.0 License.
Model description paper 14 Sep 2021
Model description paper | 14 Sep 2021
NDCmitiQ v1.0.0: a tool to quantify and analyse greenhouse gas mitigation targets
- 1Potsdam Institute for Climate Impact Research (PIK), Member of the Leibniz Association, P.O. Box 601203, 14412 Potsdam, Germany
- 2NewClimate Institute, Schönhauser Allee 10–11, 10119 Berlin, Germany
- 1Potsdam Institute for Climate Impact Research (PIK), Member of the Leibniz Association, P.O. Box 601203, 14412 Potsdam, Germany
- 2NewClimate Institute, Schönhauser Allee 10–11, 10119 Berlin, Germany
Correspondence: Annika Günther (annika.guenther@pik-potsdam.de)
Hide author detailsCorrespondence: Annika Günther (annika.guenther@pik-potsdam.de)
Parties to the Paris Agreement (PA, 2015) outline their planned contributions towards achieving the PA temperature goal to “hold […] the increase in the global average temperature to well below 2 ∘C above pre-industrial levels and pursuing efforts to limit the temperature increase to 1.5 ∘C” (Article 2.1.a, PA) in their nationally determined contributions (NDCs). Most NDCs include targets to mitigate national greenhouse gas (GHG) emissions, which need quantifications to assess i.a. whether the current NDCs collectively put us on track to reach the PA temperature goals or the gap in ambition to do so. We implemented the new open-source tool “NDCmitiQ” to quantify GHG mitigation targets defined in the NDCs for all countries with quantifiable targets on a disaggregated level and to create corresponding national and global emissions pathways. In light of the 5-year update cycle of NDCs and the global stocktake, the quantification of NDCs is an ongoing task for which NDCmitiQ can be used, as calculations can easily be updated upon submission of new NDCs. In this paper, we describe the methodologies behind NDCmitiQ and quantification challenges we encountered by addressing a wide range of aspects, including target types and the input data from within NDCs; external time series of national emissions, population, and GDP; uniform approach vs. country specifics; share of national emissions covered by NDCs; how to deal with the Land Use, Land-Use Change and Forestry (LULUCF) component and the conditionality of pledges; and establishing pathways from single-year targets. For use in NDCmitiQ, we furthermore construct an emissions data set from the baseline emissions provided in the NDCs. Example use cases show how the tool can help to analyse targets on a national, regional, or global scale and to quantify uncertainties caused by a lack of clarity in the NDCs. Results confirm that the conditionality of targets and assumptions about economic growth dominate uncertainty in mitigated emissions on a global scale, which are estimated as 48.9–56.1 Gt CO2 eq. AR4 for 2030 (10th/90th percentiles, median: 51.8 Gt CO2 eq. AR4; excluding LULUCF and bunker fuels; submissions until 17 April 2020 and excluding the USA). We estimate that 77 % of global 2017 emissions were emitted from sectors and gases covered by these NDCs. Addressing all updated NDCs submitted by 31 December 2020 results in an estimated 45.6–54.1 Gt CO2 eq. AR4 (median: 49.6 Gt CO2 eq. AR4, now including the USA again) and increased coverage.


In 2018, the Intergovernmental Panel on Climate Change (IPCC) celebrated its 30th birthday, and in 2020 climate negotiators intended to come together for the 26th annual Climate Change Conference (COP 26, Conference of the Parties). These numbers show that efforts to understand and limit climate change have already been on the international agenda for several decades. Due to another global crisis – the global Covid-19 pandemic – this year will see no annual COP, as COP 26 is now postponed until November 2021. At the COPs, international policy to limit anthropogenic climate change and avert the climate crisis that we are living in, and for which we and past generations are responsible (Rahmstorf, 2008; IPCC, 1992, 2014; Hegerl et al., 2007; Rocha et al., 2015), is negotiated. An important outcome of this process is the Paris Agreement (PA; UNFCCC, 2015), in which Parties set out their long-term temperature goal to keep global warming well below 2 ∘C compared to pre-industrial times while pursuing efforts to limit it to 1.5 ∘C. The importance of limiting global warming to reduce its negative impacts was already pointed out e.g. in the IPCC First Assessment Report (FAR; IPCC, 1992) and more recently in several IPCC Special Reports (IPCC, 2018a, 2019a, b). The IPCC Special Report on Global Warming of 1.5 ∘C (IPCC, 2018b) notes that “limiting global warming to 1.5 ∘C with no or limited overshoot would require rapid and far-reaching transitions in energy, land, urban and infrastructure (including transport and buildings), and industrial systems”. Global emissions must peak as soon as possible and drop by an annual 2.7 % in the period 2020–2030 to reach the 2 ∘C temperature goal and even by 7.6 % to reach the 1.5 ∘C goal (United Nations Environment Programme, 2019).
Nationally determined contributions (NDCs) are the backbone of the PA, in which Parties outline their contributions towards achieving the 1.5–2 ∘C temperature goal, with most NDCs including targets to mitigate national greenhouse gas (GHG) emissions. A quantification of Parties' mitigation pledges is essential to assess their ambition and to track whether countries are on course to collectively meet the PA temperature goals. Several studies showed that the current set of NDCs are not sufficient to limit global warming even to 2 ∘C (Rogelj et al., 2016; United Nations Environment Programme, 2019; CAT, 2020a), and den Elzen et al. (2019) indicated that only six of the G20 members (including China and India) are on track to actually meet their unconditional mitigation targets with current policies.
NDCs are dynamic by nature, with regular updates to “ratchet up” ambition over time (UNFCCC, 2015). Updates are requested at least every 5 years, starting in 2020, reflecting progress in science and technologies or improved national circumstances. Synchronised with the NDC updates, a global stocktake will be performed every 5 years, starting in 2023, to assess whether countries are on track to limit global warming in line with the PA global goal (UNFCCC, 2015). Estimates of NDC mitigation targets and global pathways are available, e.g. by the Climate Action Tracker (CAT, 2020) or Climate Watch (Climate Watch, 2020b), and several studies presented quantification results for specific countries. However, the quantification tools and extended descriptions of the underlying methods are seldom publicly available. We implemented a new open-source tool NDCmitiQ (NDC mitigation Quantification tool) to quantify GHG mitigation targets defined in the NDCs for all countries with quantifiable targets on a disaggregated level and to create corresponding national and global emissions pathways. NDCmitiQ can be used for the ongoing task of assessing NDCs, e.g. in the global stocktake, as it is an open-source tool which can easily be updated upon submission of new NDCs and be run with emissions data from the NDCs or independent comparison data. The intention of this paper is to give an insight into the methodologies behind NDCmitiQ and to show several examples of analyses that can be performed based on the tool's input and output data. Our aim was to implement an open-source tool with a uniform approach and flexible input to quantify national mitigation targets – including all countries – and to create national and global unconditional/conditional emissions pathways consistent with the NDCs.
Several challenges to quantifying NDCs arose during the implementation process and will therefore be described. For example, we want to use a uniform approach as far as possible, but many NDCs need country-specific information and assessment to properly understand their targets. Which data are best to use for national emissions/population/GDP if not provided in an NDC (Sect. 2.2)? What if a country does not cover its entire GHG emissions (Sect. 2.3)? How can we deal with emissions from the Land Use, Land-Use Change and Forestry (LULUCF) sector (Sect. 2.4.1)? How should national and global emissions pathways be constructed from single data points? How should a target's conditionality and range (Sect. 2.4.2) be considered?
This paper also includes background information on the different mitigation target types together with their equations and input data needed (Sect. 2.1) and on an emissions data set for 1990–2050 that we constructed from the national baseline emissions provided in the NDCs (Sect. 2.2.3). To complete the emissions data from NDCs and for comparison purposes, the time series currently used in the tool are mainly PRIMAP-hist v2.1 (PRIMAP: Potsdam Real-time Integrated Model for the probabilistic Assessment of emission Paths; Gütschow et al., 2016, 2019; Gütschow, 2019; Nabel et al., 2011) and the new data set of downscaled shared socioeconomic pathways (SSPs, Gütschow et al., 2020b). Other data sets could extend the selection. Finally, we present possible use cases for NDCmitiQ and the underlying data in Sect. 3: (i) an analysis of parts of India's NDC, (ii) an assessment of the differences between the emission data provided in NDCs and our comparison data (PRIMAP-hist, SSPs), and (iii) an analysis of the impact of different quantification options on national and global emissions pathways.
With this work, we introduce a new Python tool to quantify several types of mitigation targets stated in the currently available (intended) nationally determined contributions – (I)NDCs (submissions up to 17 April 2020 unless marked otherwise; INDCs turn(ed) into NDCs upon a Party's ratification of the PA, and no further distinction is made throughout the paper). As NDCmitiQ is implemented in Python and is publicly available, the tool can be used by researchers and results can be used by stakeholders. We chose the programming language Python for its code readability and its large user and developer community and as it can be run on various operating systems with a free software license.
As indicated, in general the paper is based on NDC submission up to mid-April 2020. Therefore, the USA is considered not to have an NDC (unless stated differently), as under former President Trump, the country withdrew from the PA. However, in the meantime, we updated the NDC information NDCmitiQ is based on to cover NDCs submitted until 31 December 2020. As this is a very recent update, it is only included in the global emissions estimates presented in Sect. 3.4 to showcase the use of NDCmitiQ and present mitigated pathways assessing NDCs up to April 2020 compared with submissions until the end of 2020, when several dozen countries updated their NDCs. These NDC updates do not generally affect the methodologies and general findings presented in this work. Regarding the USA and its contribution, its 2016 NDC is considered in the updated assessment (Sect. 3.4), as under President Biden the USA has rejoined the agreement.
By describing its methodology and the underlying data, we wish to introduce NDCmitiQ and point towards challenges in the quantification of NDCs' mitigation targets and the room for interpretation in current targets. All quantifications are based on information that we retrieved from countries' NDCs (available through UNFCCC, 2020b, a). The content of submitted NDCs varies strongly from Party to Party (e.g. Taibi and Konrad, 2018; Rogelj et al., 2017), including various types of contributions and requests, such as mitigation pledges, adaptation targets, or financial and technological needs. Most of the submitted documents include targets to mitigate national GHG emissions, which are of major importance to reach the temperature goals set out in the PA and which are the focus of our study.
In this section, we introduce the different target types that can be analysed with NDCmitiQ (Sect. 2.1), present the general approach to calculate the GHG mitigation targets (Sect. 2.1.2), and explain which information from NDCs is used as input to the quantifications (Sect. 2.1.3). Time series from non-NDC sources are used additionally as quantification input to create emissions pathways from point data given in an NDC or if no data are provided, and for comparison purposes. In Sect. 2.2, we present an overview of the time series of emissions, population, and GDP currently considered in NDCmitiQ. This is followed by details on how we deal with challenges in the quantification process regarding how to handle mitigation targets that only cover parts of a country's national emissions (Sect.2.3), how to deal with emissions from LULUCF, how to calculate national emissions pathways, and how to aggregate national pathways over several countries or globally per conditionality and range (Sect. 2.4).
2.1 Target types
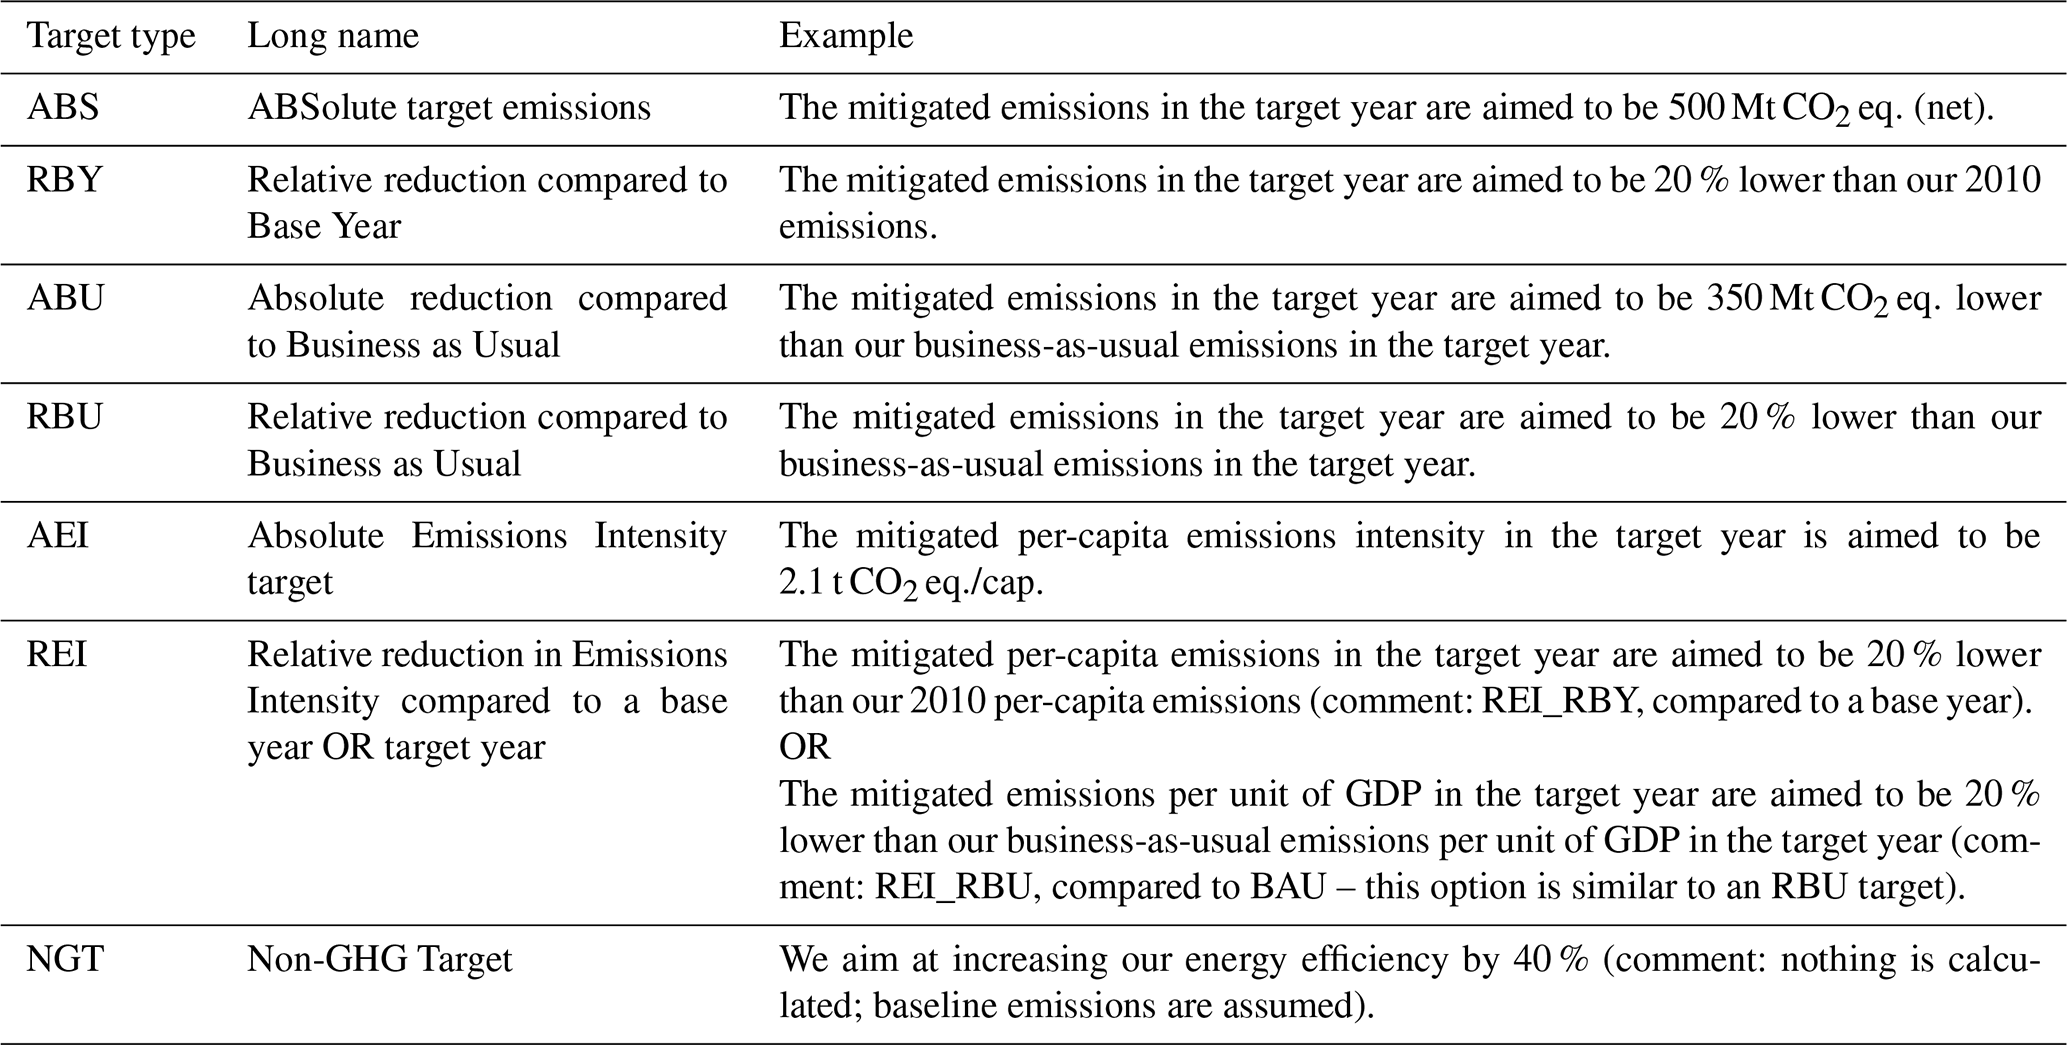
Several types of GHG mitigation targets can be found in the assessed set of NDCs. As quantifications differ between the target types, a classification of the targets is needed. All target types we differentiate in NDCmitiQ are given in Table 1. For the target types RBY and REI_RBY, reductions are compared to a historical base year, while for ABU, RBU, and REI_RBU, reductions are compared to business as usual (BAU). BAU emissions are the emissions a country would have if – starting from a certain year – no further mitigation actions were taken (inactivity scenario). Countries that indicate the year in which they plan their emissions to peak are not classified specifically, but the information is considered in the national emissions pathways (Sect. 2.4, relevant e.g. for China, who indicated an emissions peak).
Table 1GHG mitigation target types considered in NDCmitiQ, together with their abbreviations and one explanatory example per target type.
2.1.1 Classification of target types: type_main and type_reclass
In principle the classification of target types should be simple. If a country states that “we will reduce our GHG emissions by 20 % compared to BAU”, the target classification is RBU. However, what if the country also provides a quantification of its RBU target, which could then be classified as an ABS target? To use both data, we introduce two classifications: “type_main” and “type_reclass”, which in the given example are RBU and ABS, respectively.
Possible reclassifications are shown in Fig. 1: all targets could be reclassified to ABS targets if enough information is provided in the NDC. NDCs stating actions and policies (type_main: NGT) that additionally provide estimates of the mitigation effects of their planned measures can be reclassified to absolute reductions against BAU (type_reclass: ABU). In some NDCs, targets are given as different types (e.g. relative reduction compared to BAU but also stated compared to a base year), and it is not always clear which are the “official” targets, leaving room for interpretation. This uncertainty could easily be reduced in future NDCs by clear communication. The double classification not only provides important information on which countries include quantification data in their NDCs, but is also used in NDCmitiQ to quantify the targets primarily based either on emissions data from the NDCs (use type_reclass) or external data (use type_main).
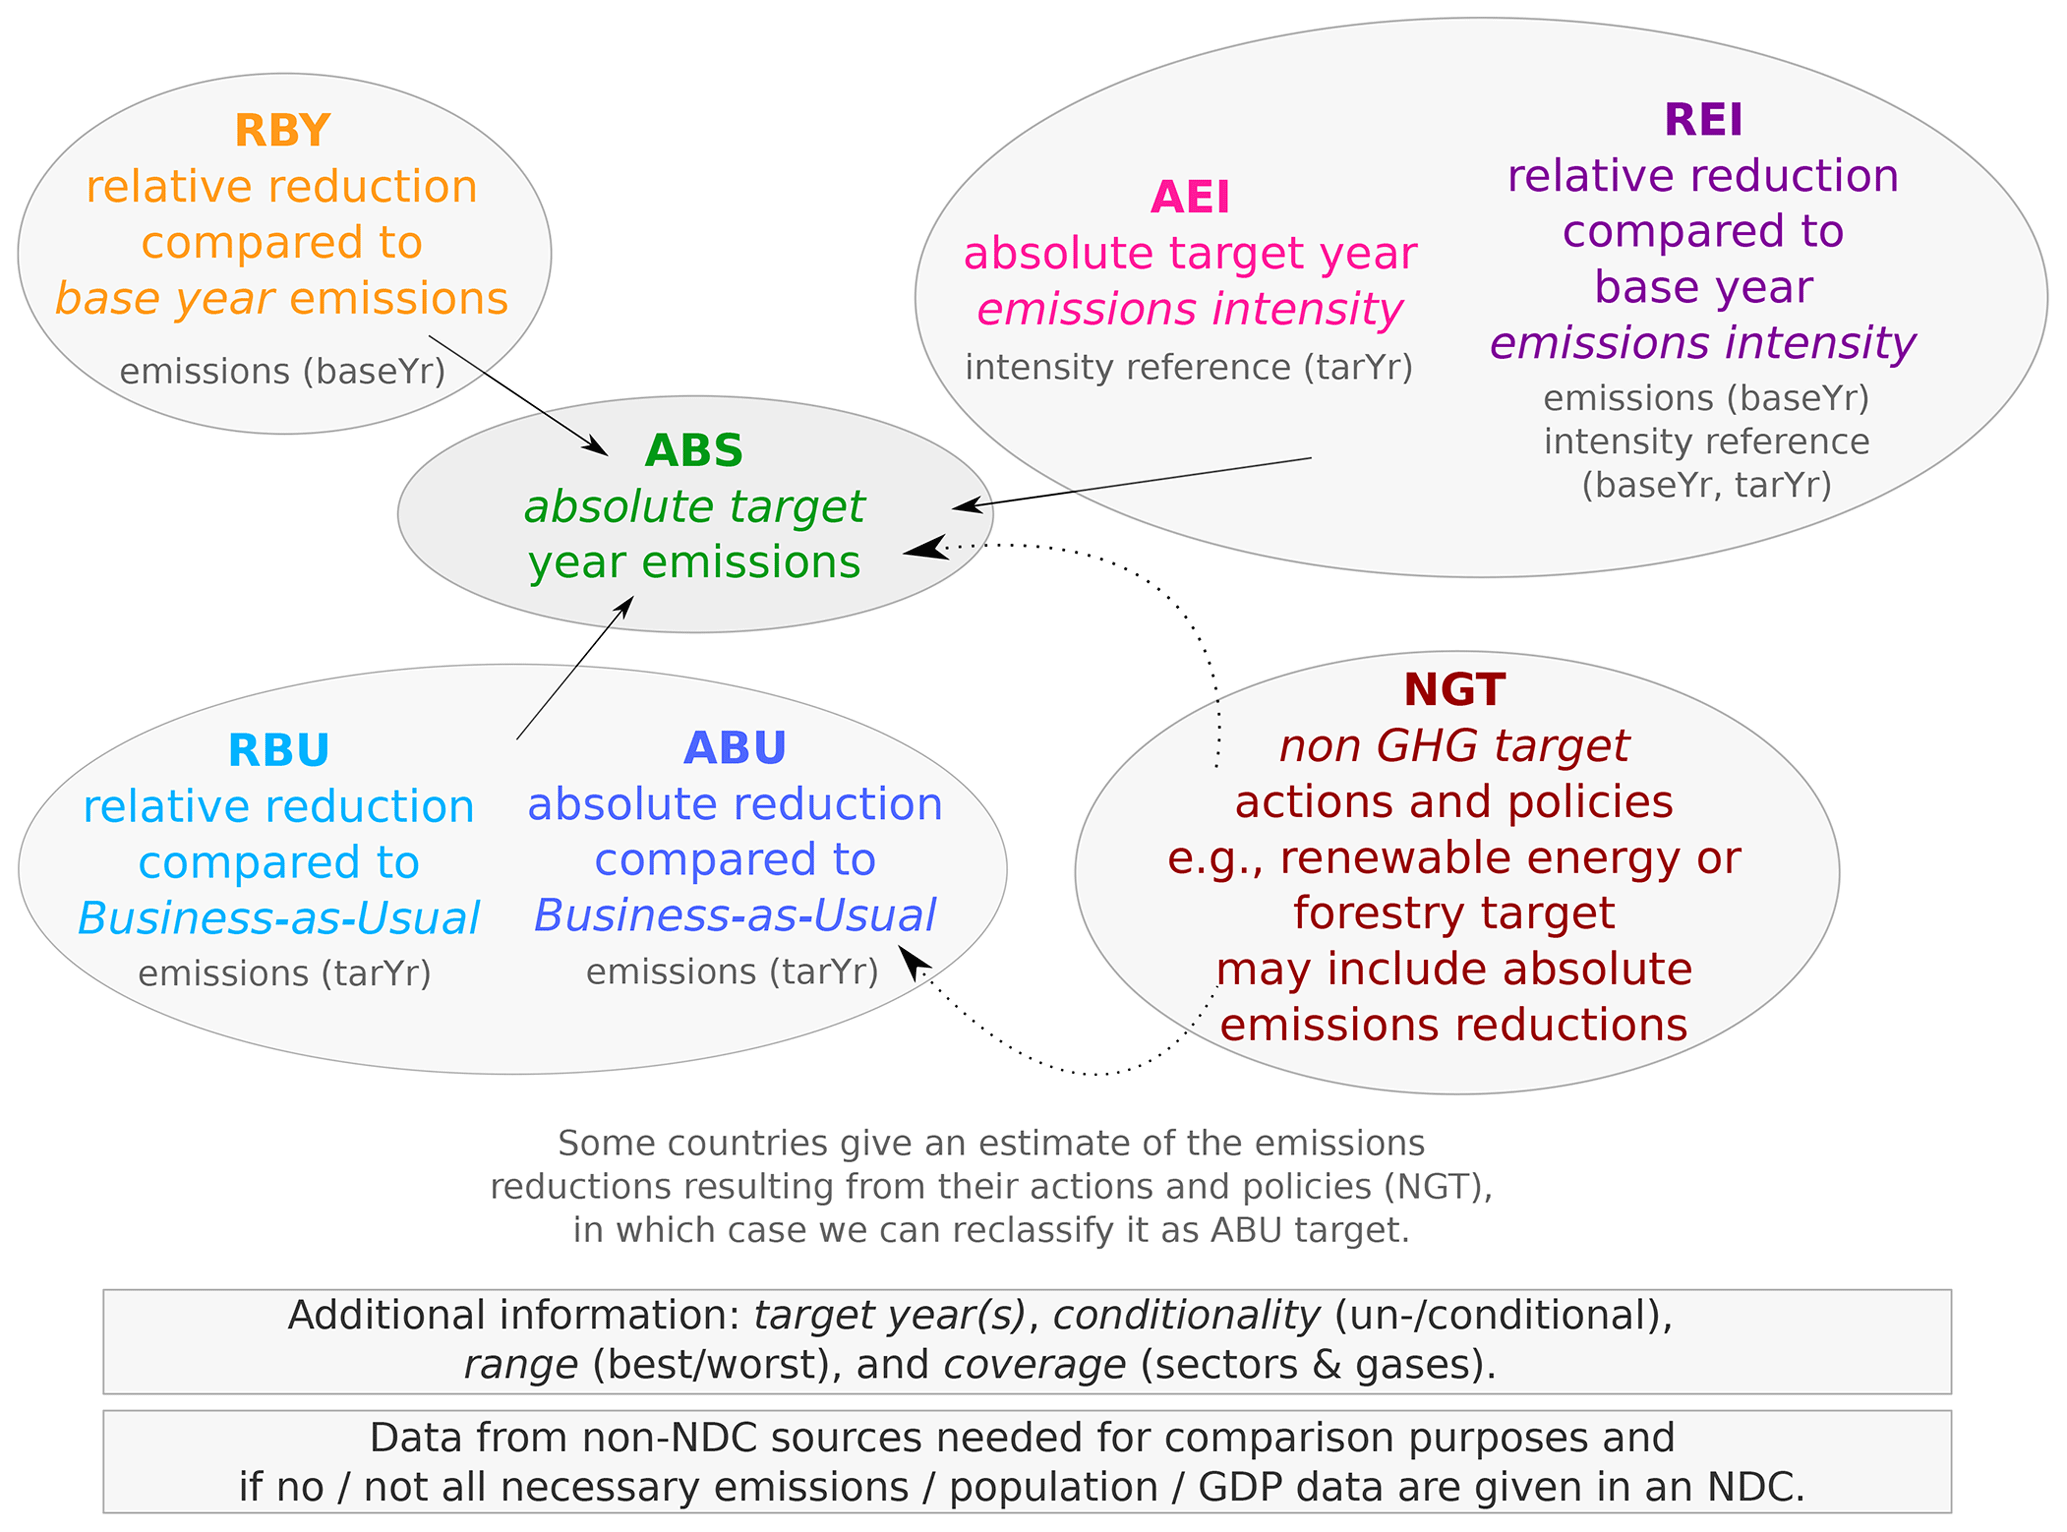
Figure 1Scheme of GHG mitigation target types and possible reclassifications. All targets can be reclassified as ABS if enough numerical information is provided in an NDC. Additionally, information on the numerical data needed for a target quantification is given.
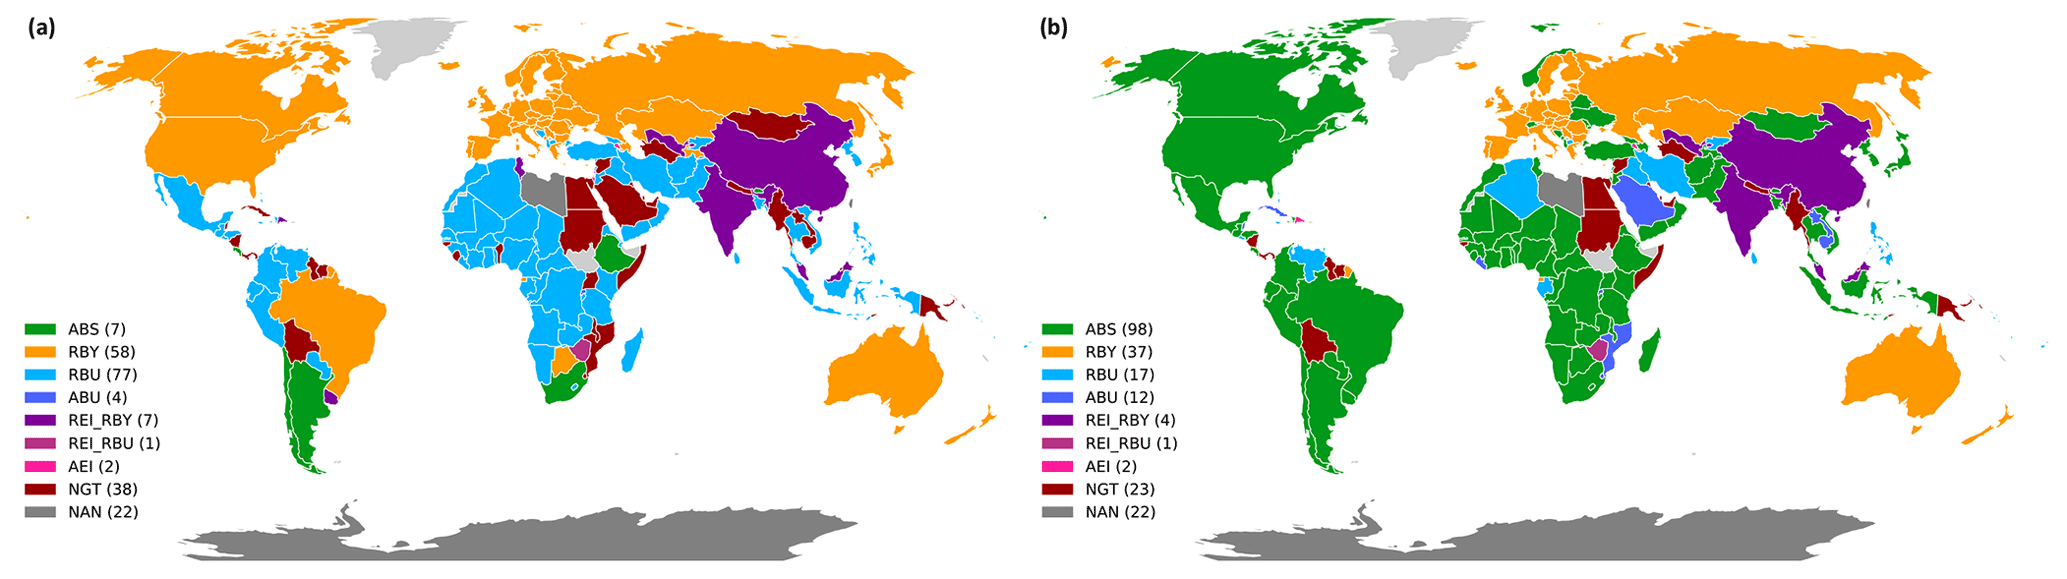
Figure 2World maps presenting mitigation target types as stated in NDCs (a: type_main) and reclassified target types – depending on the available numerical information in the NDCs (b: type_reclass). In brackets: number of countries with a certain target type (countries that are part of the EU NDC are counted as single countries). NDC submissions until 17 April 2020.

Figure 3Aggregated time series of national baseline (non-mitigated) emissions for all countries with a certain NDC mitigation target type (for type_main and type_reclass). Emissions based on PRIMAP-hist v2.1 and downscaled SSP2 marker scenario (data source: Gütschow et al., 2019, 2020b, see Sect. 2.2). Emissions from LULUCF and bunker fuels are excluded (bunker fuels: international shipping and aviation; not attributed to individual countries under the United Nations Framework Convention on Climate Change (UNFCCC); Gütschow et al., 2021). A vertical line indicates the last year of historical data (2017). USA: classified as “No NDC”. NDC submissions until 17 April 2020.
On a global scale, the reclassification of target types shows a large effect: only seven countries are classified as ABS for type_main, while the reclassification based on available emissions data in the NDCs increases this number to 98 (type_reclass), with many reclassified targets for American, African, and South-East Asian countries (Fig. 2). The aggregated emissions from countries with RBY base year targets did not change much over the past years (Fig. 3; number of countries with RBY as type_main: 58 and as type_reclass: 37, including all countries considered by the NDC of the European Union, counted as single countries). In recent years, the major share of global emissions with a clear emissions increase was caused by countries with REI emissions intensity targets, mainly due to the fact that India and China chose REI targets. For NDCs with REI targets, the reclassification of target types does not noticeably impact the global emissions share, pointing towards missing numerical data in the NDCs. The United States of America submitted a formal notification of its withdrawal from the PA to the United Nations on 4 November 2019 (Pompeo, 2019), which took effect on 4 November 2020. Therefore, emissions from the USA are counted towards “No NDC”, and the mitigation measures presented in their NDC are not considered in quantifications throughout this paper unless stated otherwise.
2.1.2 Calculating GHG mitigation targets: general equations
In NDCmitiQ we use several equations to quantify GHG mitigation targets, differentiated based on the target types. The equations presented in this section provide important information on the data needed for the quantifications and allow a first guess on possible uncertainties connected to each target type. Our general assumption is that the target emissions are the sum of the emissions in the reference year that are subject to mitigation measures (covered) plus the BAU emissions in the target year from sectors and gases that are not covered and are therefore expected to follow a business-as-usual pathway. Unless more detailed information is provided in an NDC, we assume similar efforts across all covered sectors and gases.
In the following, we introduce equations to calculate the target emissions for the different target types assessed in our module, starting with the very similar equations for RBY, REI, and RBU targets. The handling of emissions from LULUCF is not addressed here but in Sect. 2.4. We start with the equation for a relative reduction compared to base year emissions (RBY, Eq. 1).
The equation consists of the following elements.
-
emiTarget is the “target emissions”.
-
NDC, with NDC% reduction=percentage_reduction_given_in_the_NDC
(e.g. 20 % reduction compared to BAU: NDC). -
refYr and tarYr are the “reference year” and the “target year”. For an RBY target, the reference year is a historical base year.
-
emiBL is the national baseline emissions, with emiBLCOV being the share of national baseline emissions covered by the target (depending on the covered sectors and gases), while emiBLnotCOV is the not covered share of emissions. emiBL. The percentage reduction (here as NDC% level) is only applied to the covered share of emissions. emiBLnotCOV stays “untouched” by the reductions and emiBL is therefore added as is.
While for RBY the reference year is a historical year, for an RBU target (relative reduction compared to BAU) the reference year equals the target year, leading to Eq. (2).
The equation for an REI_RBY target – a relative reduction in emissions intensity compared to the emissions intensity in a historical base year – is also very similar to the RBY target. However, instead of the absolute emissions, the emissions intensity per capita or per unit of GDP is reduced. A socioeconomic growth factor has to be considered, and is added (Eq. 3; IntensityRef: national baseline population or GDP).
The equations for the remaining target types (ABS, ABU, AEI, and NGT) are given in Eqs. (4) to (7). NDCabsoluteEmissions are the target emissions, NDCabsoluteReduction is the absolute reduction, and NDCemissionsIntensity is the targeted emissions intensity per capita or unit of GDP, given in the NDC. The given absolute target emissions (ABS) and the absolute target emissions intensity (AEI) are assumed to cover the entire national emissions, otherwise the BAU emissions of the uncovered sectors and gases in the target year would need to be added.
2.1.3 Quantification input per target type and country
Based on the studied set of NDCs, we give further insight into the data needed for the quantifications by target type and country (Fig. 4 and Table A3). Some of the required information must be provided in the NDC: base year; target year; relative or absolute reduction for RBY, RBU, REI, and ABU; absolute target emissions for ABS; absolute emissions intensity for AEI. For a clearly formulated target, the information on which gases and sectors are covered and the share of covered emissions (%cov) in the base and target years should additionally be given in the NDC, otherwise the covered share of emissions relies on assumptions or one's own estimates. The assumed baseline emissions and intensity reference in the base/target year should be stated in the NDC but can also be used from “external” sources. A large number of input data requirements does not necessarily imply higher uncertainty, as can be seen for RBY targets: most of it is “easy to get”, and historical estimates generally have lower uncertainties compared to projections (e.g. BAU emissions). Nevertheless, even RBY targets can be complicated when e.g. not targeting all emissions if no emissions were recorded for the base year or if the handling of LULUCF is not clear. Based on our assessment of NDCs, Fig. 4 contains an overview of the emissions, population, and GDP data needed to quantify the targets on a country level, together with the specific years and target types (type_main). One can also conclude the chosen base and target years from this overview, with the year 2030 being the most prominent target year.

Figure 4Reference emissions, population, and GDP data needed for the assessment of current NDCs (type_main). Per country with an NDC, markers indicate that for a certain year emissions (squares), population (circles), or GDP (triangles) data are needed. Crosses indicate target years for ABS and AEI, for which no further emissions data are needed for the quantification. Black boxes indicate data needed if only parts of the national emissions are covered. Only years for which information is needed for type_main are displayed (colour coded; NGTs: shaded red area). EU target: shown for single countries (e.g. Germany). Vertical dashed lines separate countries with different initial letters. NDC submissions until 17 April 2020.
2.2 Emissions, population, and GDP data
If an NDC provides enough numerical information, the target quantifications can be based solely on the NDC data. However, if data are missing, for comparison purposes, and for the construction of emissions pathways, “external” data are needed.
Even though the required input varies substantially between Parties (Sect. 2.1.3), in NDCmitiQ we aim at a quantification in an automatic manner. Therefore, the input is time series of national emissions, population, and GDP, spanning the period of 1990–2050 and pre-processed in a similar way for all countries.
First, we present the external data currently available in NDCmitiQ (Sect. 2.2.1 and 2.2.2) and then introduce a data set of emissions time series constructed from the baseline emissions given in NDCs (Sect. 2.2.3). This data set can then be used for target quantifications and to derive mitigated emissions pathways. The presented emissions data generally follow the IPCC 2006 sectoral categorisation (IPCC, 2006), with a few additional categories following the PRIMAP-hist v2.1 nomenclature (Gütschow et al., 2016, 2019). The current implementation of NDCmitiQ is based on the global warming potentials (GWPs) of the IPCC Fourth Assessment Report (AR4; IPCC, 2007).
2.2.1 Emissions data from non-LULUCF sectors and time series of population and GDP
Historical data (1990–2017)
For the quantifications, we need time series of national emissions, population, and GDP on a country level, spanning the period 1990–2050. Historical emissions are especially important for targets referring to base year emissions (RBY, REI_RBY). For the years 1850–2017, emissions data are available from PRIMAP-hist v2.1 (Gütschow et al., 2016, 2019), for different sectors (excluding LULUCF) and gases. The PRIMAP-hist composite data set covers all UNFCCC Parties and most of the non-UNFCCC territories, with complete time series (for more information, see Gütschow et al., 2019). We use the data set version in which country-reported data are prioritised (HISTCR: Historical Data Country Reported).
For the quantification of targets with a 100 % coverage, emissions time series of national totals are sufficient. However, we also consider the covered – and uncovered – share of emissions (%cov) and test the influence on the quantification results. To derive estimates of %cov, we use various time series from the PRIMAP-hist data set (for 1990–2017), which differ regarding the contributing sectors and type of emitted gas. While the main quantifications are based on national total Kyoto GHG emissions excluding LULUCF (exclLU; contributions from LULUCF treated separately), more refined time series are used to estimate the covered share of emissions. Therefore, national emissions from the main sectors “Energy”, “Industrial Processes and Product Use” (IPPU), “Agriculture”, “Waste”, and “Other” are also used (adding up to the national totals exclLU) together with the information on the respective contributions from carbon dioxide (CO2), methane (CH4), nitrous oxide (N2O), and, for IPPU, the basket of hydrofluorocarbons (HFCs) and perfluorocarbons (PFCs) as well as sulfur hexafluoride (SF6) and nitrogen trifluoride (NF3). The Kyoto GHG basket consists of all the above-mentioned gases.
As for the non-LULUCF emissions described above, the current data source in NDCmitiQ for time series of population and GDP PPP for 1990–2017 is PRIMAP-hist Socio-Eco v2.1 (Gütschow, 2019). Historical population or GDP data are important for deriving the socioeconomic growth factor for REI_RBY targets. PPP stands for the purchasing power parity the national GDP is adjusted by for better comparability on international levels (throughout the paper we will use “GDP” for GDP PPP). Time series are complete and data are available for all UNFCCC Parties and several additional countries.
Scenarios (period after 2017)
For the period after 2017, we use emissions (exclLU), population, and GDP data published recently by Gütschow et al. (2021). In their study, SSPs (available until 2100; Riahi et al., 2017; Crespo Cuaresma, 2017; Dellink et al., 2017; Leimbach et al., 2017) were downscaled to country level. The SSPs “describe plausible major global developments that together would lead in the future to different challenges for mitigation and adaptation to climate change” (Riahi et al., 2017) and are based on five narratives (Table A8). We chose to include the five marker scenarios in NDCmitiQ, which were derived using different integrated assessment models (IAMs).
The downscaled time series of the marker scenarios for SSP1–5 are generally abbreviated as dmSSP1–5 throughout the paper, and details on the chosen projections and the approaches to handle limited data availability (i.a. for estimates of %cov) are specified in Sect. A8.
2.2.2 Emissions data from LULUCF
In the previous section, only emissions data that exclude contributions from LULUCF were discussed. However, for the quantification of mitigation targets, LULUCF emissions are often needed as well. LULUCF is “A greenhouse gas inventory sector that covers emissions and removals of greenhouse gas resulting from direct human-induced land use, land-use change and forestry activities” (UNFCCC, 2020c). As it is not always possible to distinguish the anthropogenic and natural parts of the land-related fluxes, estimating LULUCF emissions is more complex than for non-LULUCF sectors (Smith et al., 2014a). It is complicated to estimate mitigation effects by LULUCF activities, as gas fluxes depend i.a. on the age (distribution) of trees, which varies over time. LULUCF can further work as an emissions source or sink and can have high inter-annual variability (Fyson and Jeffery, 2019), and data have a high uncertainty (Roman-Cuesta et al., 2016). As a consequence of the stated problems, we distinguish between LULUCF and non-LULUCF emissions.
For LULUCF, emissions data availability is limited, with some data sources only providing a few data points, and as high inter-annual fluctuations are possible in the LULUCF emissions, reasonable gap filling is difficult. PRIMAP-hist v2.1 does not contain emissions from LULUCF “due to data availability and methodological issues” (data description document for Gütschow et al., 2019). Data scarcity and fluctuations also make it complicated to combine data sets, and estimates vary strongly between data sources (PIK, 2020).
To choose external national LULUCF emissions data for the target quantifications, several data sets of LULUCF emissions are analysed for available data in the following prioritised order: CRF 2019, CRF 2018, BUR 3, BUR 2, BUR 1, UNFCCC 2019, and FAO 2019 (abbreviations: Sect. A2). For a country, CRF 2019 data are used if available, else CRF 2018, and so on. Estimates of LULUCF emissions provided by Parties are chosen when possible (similarly to e.g. PRIMAP-hist v2.1 HISTCR for non-LULUCF emissions, Gütschow et al., 2019, or Fyson and Jeffery, 2019, for LULUCF emissions). As in Fyson and Jeffery (2019), we include FAO 2019 data, which are calculated using the IPCC methodologies and are based on country-reported data. However, their definitions and data coverage differ (Tubiello et al., 2015), and they “are not directly comparable with UNFCCC data” (Fyson and Jeffery, 2019). As we intend to work with complete time series in order to have complete emissions pathways up to 2030 or 2050, gap filling and extrapolation are applied (Sect. A2), neglecting to some extent the challenges with LULUCF emissions described above. Our projections are generally based on constant extrapolation of the average 2010–2017 emissions (more details in Sect. A2).
Globally, in 2017 LULUCF was an estimated net sink of −2.1 Gt CO2 eq. (GWP: AR4), with the estimate based on data that we chose from different sources on country level (prioritisation as above and details in Sect. A2). In Fig. 5, the distribution of global LULUCF estimates based on all possible combinations of data source prioritisations is shown for several time periods together with the global aggregates resulting from the three prioritisations implemented in NDCmitiQ. Regarding the distribution, one has to consider that estimates are biased towards country-reported data, as only one FAO version is included in this assessment. In comparison to the −2.1 Gt CO2 eq., in all non-LULUCF sectors a total of 47.6 Gt CO2 eq. was emitted in 2017 (based on PRIMAP-hist v2.1 HISTCR, excluding LULUCF and bunker fuels). The aggregated 2030 estimates of net LULUCF emissions (−2.2 Gt CO2 eq.) are in line with the estimate by Fyson and Jeffery (2019) (−2.0 Gt CO2 eq. yr−1). If FAO 2019 is chosen as the primary data source, the global 2017 aggregate is an emissions source of +3.4 Gt CO2 eq. instead of a global sink. As pointed out in Fyson and Jeffery (2019), the choice of the LULUCF data source has considerable effects on the best estimate for the year 2030 in some cases, and the higher global aggregate of +3.4 Gt CO2 eq. (2017) when prioritising FAO data is in line with their estimate based only on FAO data (3.3 Gt CO2 eq. yr−1, 2004–2014, further comparisons in their study).

Figure 5Distribution (percentiles) of global Kyoto GHG LULUCF emissions for different orders of data source prioritisation and time periods. Lines show the percentiles of the emissions for all 5040 possible combinations of the considered data sources. Per period, the prioritisations implemented in NDCmitiQ are shown on the right (checking data availability on country level; default: “Prio CRF”). 2018–2050 estimates are similar to the 2010–2017 average per default (using a linear extrapolation of 2010-2017 averages).
2.2.3 Emissions data from the NDCs
While the above-mentioned data are time series from non-NDC sources, to quantify the targets, our intention is to also use the emissions data provided in the NDCs when available. With NDCmitiQ, we are aiming to create national emissions pathways and global aggregates from the quantified targets. However, in NDCs, emissions are generally given as point data, not counting in data visualisations, from which it is often difficult to read the numbers. The external data sources serve to complement the NDC data to emissions pathways and for comparison purposes. As output from NDCmitiQ, we intend to create mitigated emissions pathways that exclude LULUCF emissions, and we therefore construct a data set of national baseline emissions time series excluding LULUCF (1990–2050) that is based on the NDCs' baseline emissions, combined with PRIMAP-hist and SSP data for completeness (see Sect. A3).
If available, the following baseline emissions data were retrieved from the NDCs: excluding LULUCF (“exclLU”), including LULUCF (“inclLU”), and LULUCF only (“onlyLU”). As it is not always clearly stated what the provided emissions stand for, some of the classifications are based on a best-guess approach. The emissions estimates are used as long as one can assume that all – or most – of a country's emissions are included.
2.2.4 Global warming potentials
Emissions throughout this paper, and in most of the NDCs, are given as CO2 equivalents to make emissions from different gases comparable and provide basket emissions. Emissions in CO2 eq. follow a certain GWP, with all emissions in NDCmitiQ currently being based on GWPs from the IPCC Fourth Assessment Report (AR4; IPCC, 2006). Inconsistencies can arise when using NDC emissions data (baseline emissions and ABS, ABU, and AEI targets), which are partly based on GWPs from the IPCC Second or Fifth Assessment Report (SAR, AR5; IPCC, 1996, 2014) or unspecified.
To reduce the uncertainty resulting from emissions based on different GWPs, we apply national conversion factors to the NDC emissions data given in GWPs from SAR. The conversion factors are derived from PRIMAP-hist v2.1 HISTCR Kyoto GHG national totals (excluding LULUCF; national averages for the period 2010–2017). Conversion factors are only calculated from SAR to AR4, as from PRIMAP-hist Kyoto GHG emissions are not available for GWPs from AR5 due to missing AR5 data for HFCs and PFCs.
Global Kyoto GHG emissions in 2017 were 46.3 Gt CO2 eq. following GWPs from SAR (excluding LULUCF and bunker fuels) and 47.7 Gt CO2 eq. for AR4, equivalent to a 2.8 % increase in their estimated forcing over a period of 100 years. The higher the national share of CO2 emissions, the lower the effect of a change in GWPs, as the GWP of CO2 is 1 by definition. A clear communication by Parties of the applied GWPs can reduce this uncertainty in emissions data retrieved from NDCs and ultimately in the quantification of the target. We assess 50/35/5 countries to follow GWPs from SAR/AR4/AR5, representing 6.9 %/33.7 %/4.2 % of global Kyoto GHG emissions (year 2017, excluding LULUCF and bunker fuels). For the remaining countries we could not retrieve information on chosen GWPs from their NDCs and assume the given emissions to follow the GWPs from AR4.
In the Katowice Climate Package (Annex to decision 18/CMA.1: Modalities, procedures and guidelines for the transparency framework for action and support referred to in Article 13 of the Paris Agreement; UNFCCC, 2019d), it was decided for the “National inventory report of anthropogenic emissions by sources and removals by sinks of greenhouse gases” (II) that “Each Party shall use the 100-year time-horizon GWP values from the IPCC Fifth Assessment Report, or 100-year time-horizon GWP values from a subsequent IPCC assessment report as agreed upon by the CMA, to report aggregate emissions and removals of GHGs, expressed in CO2 eq.” (II.D.37). Implementation of these principles would lead to increased clarity, and applying these principles to their NDCs would also further increase transparency.
2.3 Share of emissions covered by NDCs
In the assessed set of NDCs, not all mitigation targets cover the total of national emissions. To estimate the uncertainty in target emissions resulting from different assumptions about the share of covered emissions (%cov), and for comparison purposes, two options are implemented in NDCmitiQ: use %cov=100 % or estimates of %cov that are based on the stated targeted sectors and gases, as described in the current section. Additionally, estimates of %cov indicate which countries have room to improve their coverage in an updated NDC.
With Article 4.4 of the Paris Agreement (UNFCCC, 2015), Parties to the PA agreed on the following: “Developed country Parties should continue taking the lead by undertaking economy-wide absolute emission reduction targets. Developing country Parties should continue enhancing their mitigation efforts, and are encouraged to move over time towards economy-wide emission reduction or limitation targets in the light of different national circumstances.” To reduce uncertainties and increase transparency, the targets' scope should be defined in NDCs in terms of covered sectors and gases and in numerical values of %cov in the historical base year (if needed) and the target year. It should be clear which emissions are targeted by mitigation actions or stay “untouched” and are intended to develop under a business-as-usual pathway, but not all Parties clearly communicated this information.
We assessed the NDCs for information on the covered sectors and Kyoto GHGs to estimate %cov, focusing on the main sectors Energy, IPPU, Agriculture, Waste, Other, and LULUCF, the single gases CO2, CH4, N2O, SF6, and NF3, as well as the gas baskets of HFCs and PFCs. In all NDCs we could find some information on targeted sectors – not always clearly stated, however – and not all NDCs include information on the covered gases, leaving room for interpretation (unclear cases for sectors: 38 NDCs, and for gases: 27 NDCs). The rules to determine %cov for the national emissions excluding LULUCF are presented in Sect. A5 (results: Sect. 3.1). In general, for years up to 2017, %cov is derived from the PRIMAP-hist emissions data per sector and gas combination, while estimates for later years are either based on a constant extrapolation of recent %cov or on the correlation between national total and covered emissions. Regarding LULUCF emissions, the applied rule is simple: if the sector is assessed to be covered, its total emissions are assumed to be covered (not taking into account the contributions of the different gases relevant for LULUCF emissions: CO2, CH4, N2O).
2.4 Target emissions and emissions pathways
In order to quantify the Parties' targets, we assessed all NDCs regarding their target types, target years, conditionality and range, covered sectors and gases, and provided emissions. National target emissions are calculated for each target year, conditionality, and range. NDCs include either or both unconditional and conditional targets (“conditionality”), where mitigation actions are conditional upon, for example, international financial support or technology transfer. Some Parties decided to give a range rather than an exact target value (e.g. “unconditional reduction of 26 %–28 %”), which we treat here as “best” and “worst”, meaning more and less ambitious.
Section 2.4.1 contains information on how we deal with targets that include contributions from LULUCF, how we derive target emissions excluding LULUCF in these cases, and why a separation into emiTargetinclLU and emiTargetexclLU is useful. To analyse whether the pledges put us on track to limit global warming to 1.5–2 ∘C, regional or global emissions pathways are needed. Therefore, national emissions pathways that are consistent with the NDC targets for the single target years must be constructed and aggregated. The methodology and options for pathway creation implemented in NDCmitiQ are explained in Sect. 2.4.2.
2.4.1 Target emissions: including and excluding LULUCF
LULUCF and its contributions towards a mitigation goal complicate target quantifications (e.g. Forsell et al., 2016; Fyson and Jeffery, 2019; Hargita and Rüter, 2015), which is why for example the Climate Equity Reference (2018) “dropped support for including LULUCF emissions in the assessment of the NDCs – the quality of the data and of the information in the NDCs simply wasn't good enough to do that with confidence”. Reasons for the LULUCF component being an issue are that there are large uncertainties in the LULUCF emissions data, LULUCF emissions can have high inter-annual variability, LULUCF can be a net sink and countries can use this sector to disguise increased emissions or missing mitigation ambition in the non-LULUCF sectors, and comparability between national mitigation goals is easier when excluding LULUCF contributions. We derive target emissions estimates excluding LULUCF.
In order to quantify mitigation targets excluding LULUCF and treat the LULUCF component separately, we classified target information from the NDCs as including and excluding LULUCF (inclLU and exclLU). In principle, when LULUCF is assessed to be covered and the NDC does not indicate otherwise, the target information is assigned to inclLU (e.g. a 20 % reduction vs. BAU with LULUCF being covered is “RBU inclLU”) or else to exclLU (“RBU exclLU”). Unfortunately, as it is not always clear whether the NDC includes LULUCF in its mitigation target and whether LULUCF emissions are included in provided baseline emissions, the classification sometimes relies on our judgement.
Target emissions are generally calculated based on Eq. (1) to (7) (Sect. 2.1.2), and we derive estimates for both emiTargetinclLU and emiTargetexclLU. The emissions from LULUCF are treated separately when possible, but this is not always feasible. When e.g. the quantification is based on NDC data and information on the LULUCF emissions contribution is not provided, no distinction is made between a LULUCF and non-LULUCF part. If enough data are available, however, we use the following approach to derive emiTargetinclLU and emiTargetexclLU (Table 5: an example for India's REI_RBY target inclLU with a LULUCF sink in the base year is assessed). Even though very detailed, we consider the following information to be relevant as the treatment of LULUCF is a major problem for NDC quantifications, which is why it deserves our attention.
Target excludes LULUCF
Target includes LULUCF
-
Target types ABS, AEI, and ABU: use the ABS target as emiTargetinclLU or calculate emiTargetinclLU from AEI (multiplication by IntensityReftarYr) or from ABU (reduction of the BAU emissions in the target year by the given absolute reduction).
-
Target types RBY, REI, and RBU.
-
We assume the same mitigation effort in all sectors and apply the same relative reduction to all sectors unless stated differently in the NDC.
-
(net source): LULUCF treated as the other covered sectors and reduced by a given relative reduction.
-
(net sink): sink is left as is. We chose not to strengthen the sink (attention when choosing to strengthen the sink: applying a relative reduction to negative values would weaken the sink potential). LULUCF emissions and targets are connected to uncertainties (Fyson and Jeffery, 2019). Further, stringent non-LULUCF emissions reductions are of major importance for climate neutrality (IPCC, 2018a), and carbon sequestration in vegetation and soils comes with a time component (saturation of mitigation potential; created enhanced carbon stocks are reversible and non-permanent, Smith et al., 2014b; vegetation or tree age, Pugh et al., 2019, Köhl et al., 2017, Stephenson et al., 2014, and Carey et al., 2001).
-
-
Calculate emiTargetexclLU by subtracting the projected LULUCF emissions:
. -
If for a country a resulting emiTargetexclLU becomes negative, which could only be achieved with negative emissions technologies and reliable sequestration, we use a second approach for LULUCF.
-
Split the absolute reduction in the target year against the baseline emissions ABUinclLU into ABUexclLU and ABUonlyLU, depending on the respective contributions of and
. -
Reduce the baseline emissions by the corresponding ABUexclLU.
-
-
ABU targets: if the absolute reduction exceeds the assumed BAU emissions , the then negative target is set to emiTargetexclLU=0 Mt CO2 eq.
For several countries, the Climate Action Tracker uses a somewhat comparable approach to derive target emissions excluding LULUCF from mitigation targets that include LULUCF – given in the NDC or calculated by applying the given reductions to the reference year emissions that include LULUCF: the projected LULUCF target year emissions are subtracted from the target emissions that include LULUCF (see e.g. CAT, 2019a, b, for Australia and Brazil).
Table 2Options for emissions pathway calculations for countries with a mitigation target but without a target for the year 2030. In this example are the country targets for a 20 % reduction compared to BAU in 2025. The relative differences from the baseline emissions from 2020 to 2025 evolve linearly from 0 % to −20 %. After 2025, either the relative difference from the baseline is kept at the level of the last target year (default: option “constant percentages”, −20.0 % in this example, in italics), the absolute difference from the baseline emissions is kept constant (option “constant difference”, here: −4.4 Mt CO2 eq.), or the absolute emissions are kept at the level of the last target year (option “constant emissions”, here: 17.6 Mt CO2 eq., in italics). The baseline emissions follow the chosen baseline scenario.

When quantifying all available targets, based on the downscaled marker scenario for SSP2 (dmSSP2), with NDC emissions data prioritised if available and an assumed coverage of 100 %, the “second approach for LULUCF” is needed for seven countries, and for Tonga the ABUexclLU exceeds the baseline emissions (type_main: NGT, type_reclass: ABU).
2.4.2 Emissions pathways
One of our main goals is to construct global emission pathways up to 2030, consistent with the NDC mitigation targets. For the aggregation, rather than quantified target emissions for single years, time series are needed, defined by interpolation between target years and extrapolation after the last target year if it is before 2030. Pathway calculations start in 2021, the first year after the Kyoto Protocol period and the first year of the PA period (before 2021: baseline emissions), and a linear increase or decrease in the relative difference from the baseline is assumed between target years, while the relative difference is kept constant after the last target year (Table 2). If the baseline increases, a constant relative difference results in an increasing mitigation pathway but with a smaller growth rate. To prevent the pathway from increasing a lot, the inter-annual baseline growth rates are used if the target in the last target year is above the baseline. Second and third non-default options for the calculation of national pathways are implemented in NDCmitiQ: a constant absolute difference from the baseline emissions or constant emissions after the last target year. For countries that indicated an emissions peak year, such as China, the calculated pathway is used in case it declines starting in the peak year or earlier, otherwise the intended trajectory is approximated by keeping the national emissions constant after the peak year. Emissions baselines currently available in NDCmitiQ are either the constructed NDC emissions pathways (Sect. 2.2.3) or the downscaled SSP marker scenarios (Sect. 2.2.1).
We aim for globally aggregated emissions pathways per conditionality and range (in decreasing ambition order: unconditional best and worst, conditional best and worst). If for the current target type, conditionality, and range values for emiTarget are available for several years, all are used to construct the current pathway. Additionally, if an unconditional but no conditional target is stated for a certain year, we consider the unconditional target for the conditional pathway as well (if a target is available for X in year 20xx but not for Y, also use X for the Y pathway, with X and Y in this order: unconditional best and unconditional worst, conditional best and conditional worst, and unconditional best and conditional best and worst).
For countries without quantifiable mitigation targets, the baseline emissions are assumed to be unconditional/conditional pathways. Furthermore, if a country only has conditional targets, the baseline is used as unconditional pathways. However, in some of these cases the conditional pathway is worse than the baseline, which would result in a worse conditional than unconditional pathway. As this does not seem logical, the conditional (worst) pathway is also used as unconditional best and worst pathways if this happens. An option to disable this method and use the baseline as unconditional pathways nevertheless is implemented in the tool (not default).
Table 3Share of emissions covered by NDCs. All values exclude emissions from LULUCF and bunker fuel emissions. All values are based on PRIMAP-hist v2.1 HISTCR emissions data (GWP AR4). “NDCs (Adapt.)”: number of countries that stated (more or less explicitly) that they are covering a certain sector or gas (in brackets: adapted value based on rules given above; EU: counting single countries). The given shares represent the part of emissions per sector plus gas combination that is estimated to be covered (relative to the global emissions from this sector–gas combination) and the total per sector or gas (“Share”; e.g. an estimated 80.7 %/82.8 % of global energy/energy CO2 emissions are covered). Countries with NGT targets that state covered sectors and gases are included in the presented numbers. Complementary information is provided in Table A6. NDC submissions until 17 April 2020.
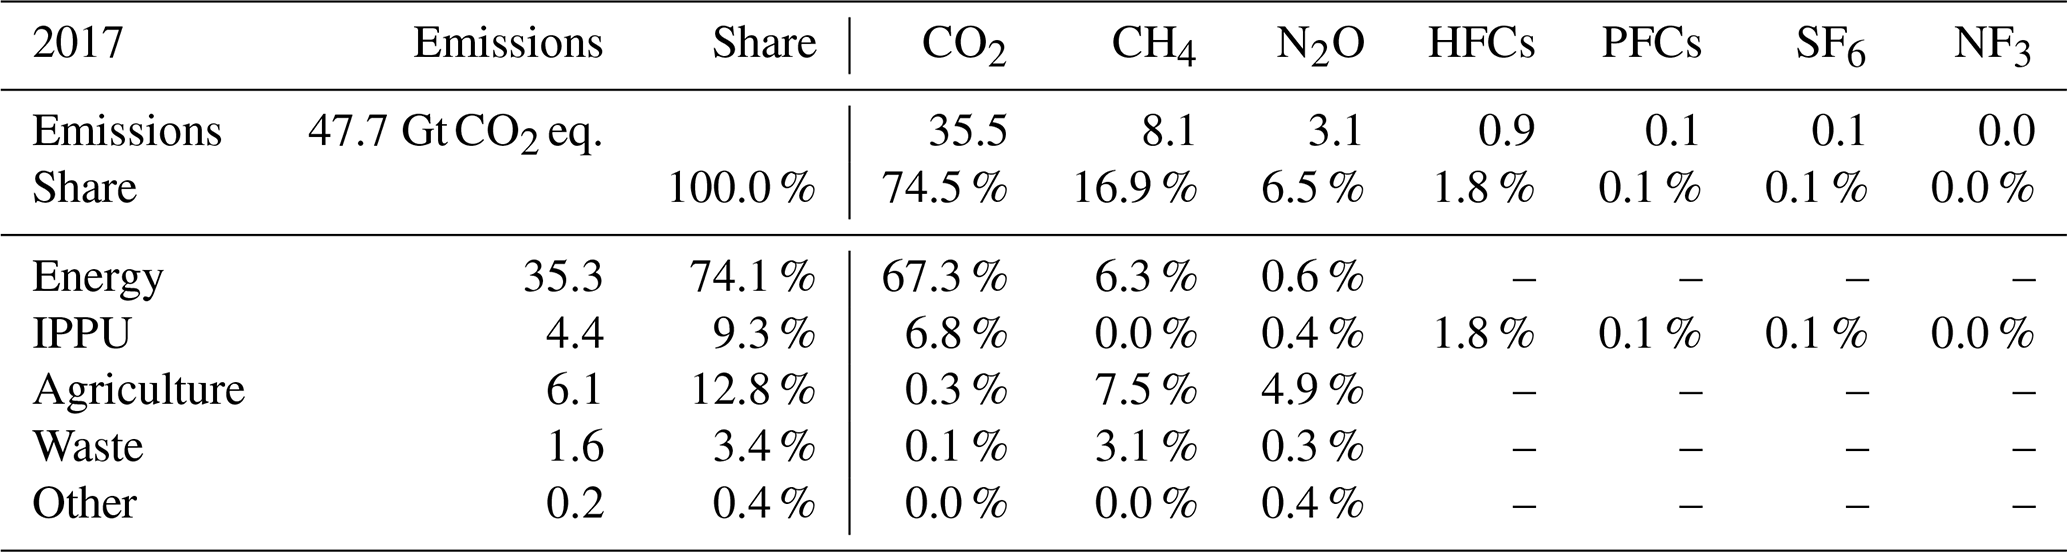
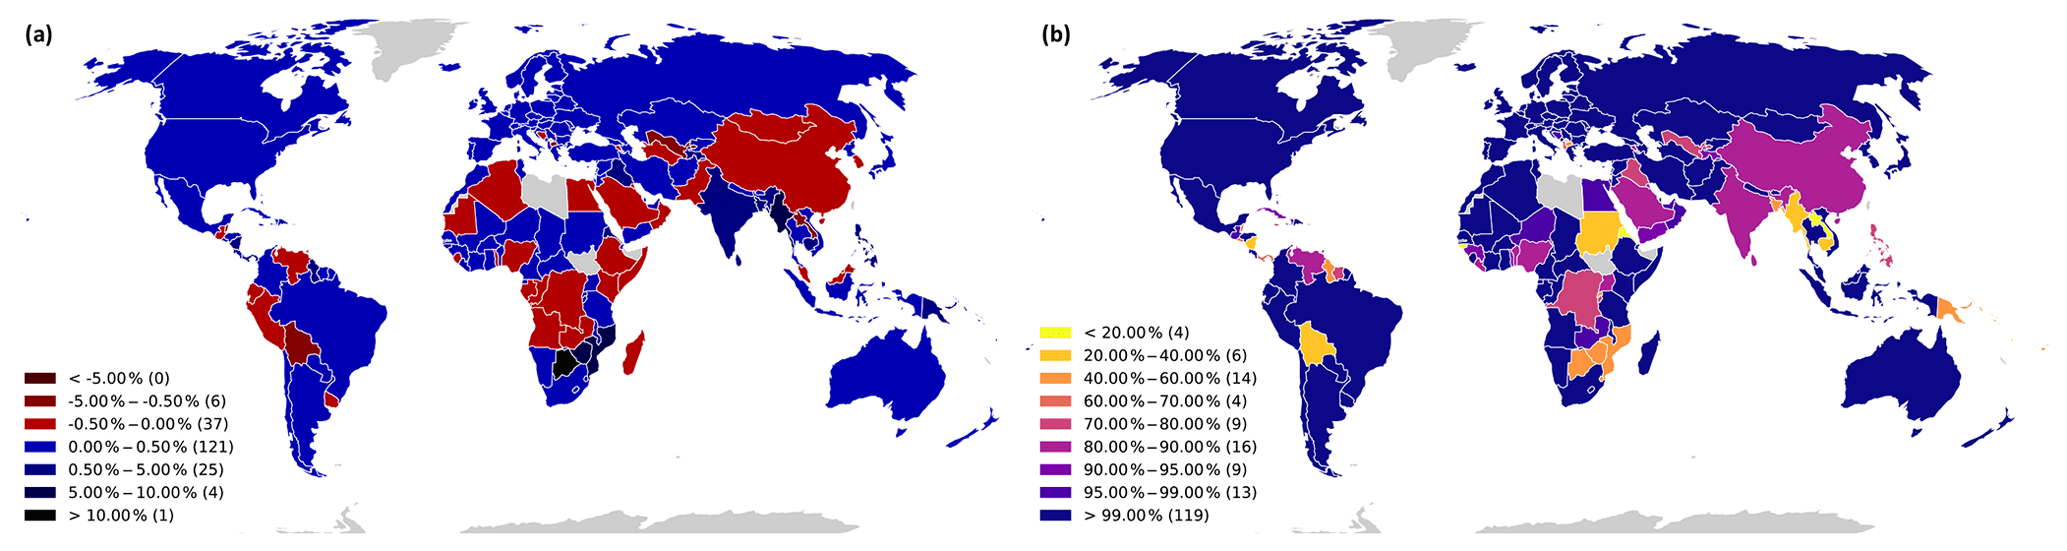
Figure 6(a) Share of Kyoto GHG emissions assumed to be covered by a country's NDC mitigation target (for 2017). (b) Average trend of %cov 2010–2017 in % yr−1 (based on linear regression to national %cov 2010–2017). All values are based on PRIMAP-hist v2.1 HISTCR emissions, following GWP AR4 and excluding emissions from LULUCF and bunker fuels. NDC submissions until 17 April 2020.
The national pathways are finally aggregated to regional/global emissions pathways, per conditionality and range. Per country, one target type is prioritised for the aggregation, which can be type_main or type_reclass (Sect. 2.1.1). Further options to modify the target or pathway calculations are implemented in NDCmitiQ. These non-default options that can be chosen for comparison runs and sensitivity analyses are presented in Sect. A6 and consist of the following options: “targets only for countries X, Y, Z”, “prioritised target types”, “countries without unconditional targets and what if baseline is better than the conditional targets”, “countries with targets above baseline and whether to use the baseline in these cases”, “set coverage to 100 %”, and “strengthen targets”. As we do not perform policy analyses, and for comparison purposes, the option “use Climate Action Tracker estimates for countries X, Y, and Z if available” can be chosen. We gathered the target estimates provided by the CAT (estimates exclLU with GWP from AR4; source: CAT, 2020) for all countries with assessments available. From these point values, we construct national mitigated emissions pathways in the same manner as described above, which can then be used for the global aggregates instead of NDCmitiQ target quantifications.
Throughout Sect. 2, the methodology of NDCmitiQ to assess NDCs and quantify their mitigation targets was explained, providing information on the data sets of emissions, population, and GDP currently in use in NDCmitiQ. We presented important background information needed for target calculations and gave some insights into possible uncertainties. Now, we wish to demonstrate example use cases of the input and output data of NDCmitiQ: assessment of the covered share of emissions; baseline emissions from within NDCs compared to SSP baselines; national GHG mitigation targets: example India, with general importance of the results; and global mitigation pathways: influence of different quantification options.
Table 4Baseline emissions data provided in NDCs compared to our baseline emissions (separated into excluding and including emissions from LULUCF). For the base and target years of the mitigation targets, all emissions data provided in the NDCs are aggregated (row “NDCs”) and compared to our baseline emissions (aggregate over the same countries; row“dmSSP2”). Baseline emissions: see Sect. 2.2 (PRIMAP-hist v2.1 1990–2017, dmSSPs, LULUCF emissions, all excluding bunker fuels). “Difference from dmSSP2”: how do the NDC values compare to the dmSSP2 baseline? NDC emissions based on the GWP from SAR were converted to AR4 using national conversion factors. NDC submissions until 17 April 2020.
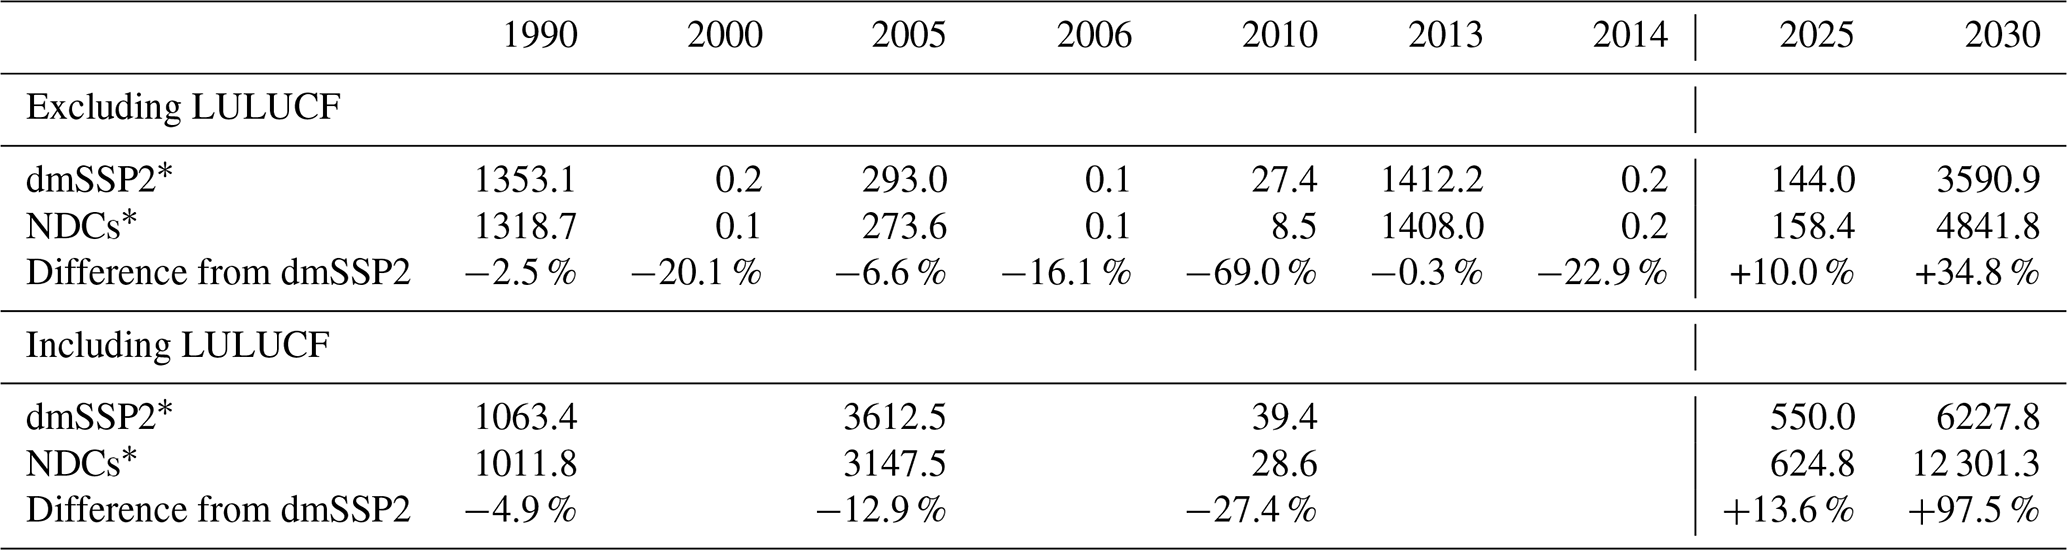
* Mt CO2 eq. AR4.
3.1 Share of total emissions covered by NDC
On a country level we retrieved information on the sectors and gases covered (Fig. A1) and estimated the corresponding covered share of emissions (Table 3 and Fig. 6; excluding LULUCF). The Energy sector and the GHGs CO2, CH4, and N2O are considered in many NDCs (mentioned by 193, 174, 157, and 147 countries, respectively, countries that are part of the EU target counted as single countries). Additionally, for a more complete picture in reference to countries' emissions, Sect. A7 includes information on sectoral and per-gas shares together with emissions and trend maps. In total, we assess 77 % of 2017 global emissions to be emissions from sectors and gases covered by the studied NDCs. An estimated 1 % was emitted by countries without an NDC plus about 14 % by the USA. This leaves 9 % of uncovered emissions from countries with an NDC. Including the USA would increase the covered share significantly to 91 %. Article 4.4 of the PA (UNFCCC, 2015) asks developed countries to implement economy-wide absolute emission reductions, which is reflected in the high %cov for developed countries; 53/75 countries are assessed to cover less than 90 %/99 % of their emissions, including China and India, which contributed 27 % and 6 % of 2017 emissions, and for 43 countries emissions from the uncovered sectors and gases have gained in importance over recent years (negative trend of %cov). The influence of %cov on India's target emissions and on a global scale is further discussed in Sect. 3.3 and 3.4.
We do not consider the covered share of emissions for ABS and AEI targets, which can introduce an uncertainty. While the 99 countries classified as ABS and AEI targets for type_reclass (absolute emissions or absolute emissions intensity, excluding the USA) are responsible for one-fourth of global emissions (2017: 24.9 %, 2030: 25.2 % following dmSSP2, excluding LULUCF and bunker fuels), the uncovered share of emissions for these countries is only 0.4 % of 2017 global emissions, and the uncertainty introduced is low.
3.2 Emissions data from the NDCs vs. dmSSPs
We retrieved emissions data from all NDCs with available data and classified them as including or excluding LULUCF to use the emissions in the target quantifications. In Table 4 the emissions from NDCs are compared with external baseline emissions data (before 2017: national emissions from PRIMAP-hist v2.1 HISTCR (exclLU); after 2017: downscaled SSP2 marker scenarios (dmSSP2, exclLU); and LULUCF emissions data as described in Sect. 2.2). Table A9 additionally includes information on dmSSP1–5, the number of Parties from which we could extract emissions data from their NDC, and these countries' global emissions share (for dmSSP2). In all the historical years in Table 4, the aggregated NDC baseline emissions are lower than the comparison baselines. To some degree, lower values can be connected to a discrepancy between the sectors and gases that are included in the provided data, which are not always clearly stated in the NDCs (comparison data: national totals). Even though the estimated baseline emissions for 2025 under the NDCs are in the range of the dmSSPs, they are at the very upper edge – dmSSP5 – which is the most extreme pathway with the strongest emissions increase. For 2030, the aggregated NDC baseline emissions are even higher than dmSSP5, with data from 25 countries available for the assessment of emissions exclLU and the countries representing 5.4 % and with data from 42 countries available for the assessment of emissions inclLU and the countries representing 9.8 % of global emissions in 2030 under dmSSP2 (middle-of-the-road scenario). The emissions estimates provided in NDCs for 2030 are +34.8 %/+97.5 % or +1.3/+6.1 Gt CO2 eq. higher than dmSSP2 for the corresponding countries (for exclLU/inclLU). Targets with reductions relative to business-as-usual emissions are higher, the higher the expected BAU emissions are. If an unrealistically strong increase in BAU emissions is assumed, it results in higher and easier-to-reach target emissions. Another incentive for countries to have high baselines is that they can reflect a strongly growing economy. Using independent, country-specific comparison data is helpful for putting national estimates into perspective. However, for the purpose of quantifying the NDCs' mitigation targets, it is most helpful to use the BAU emissions provided in the Parties' documents, if available, as this is most consistent with what the country has pledged.
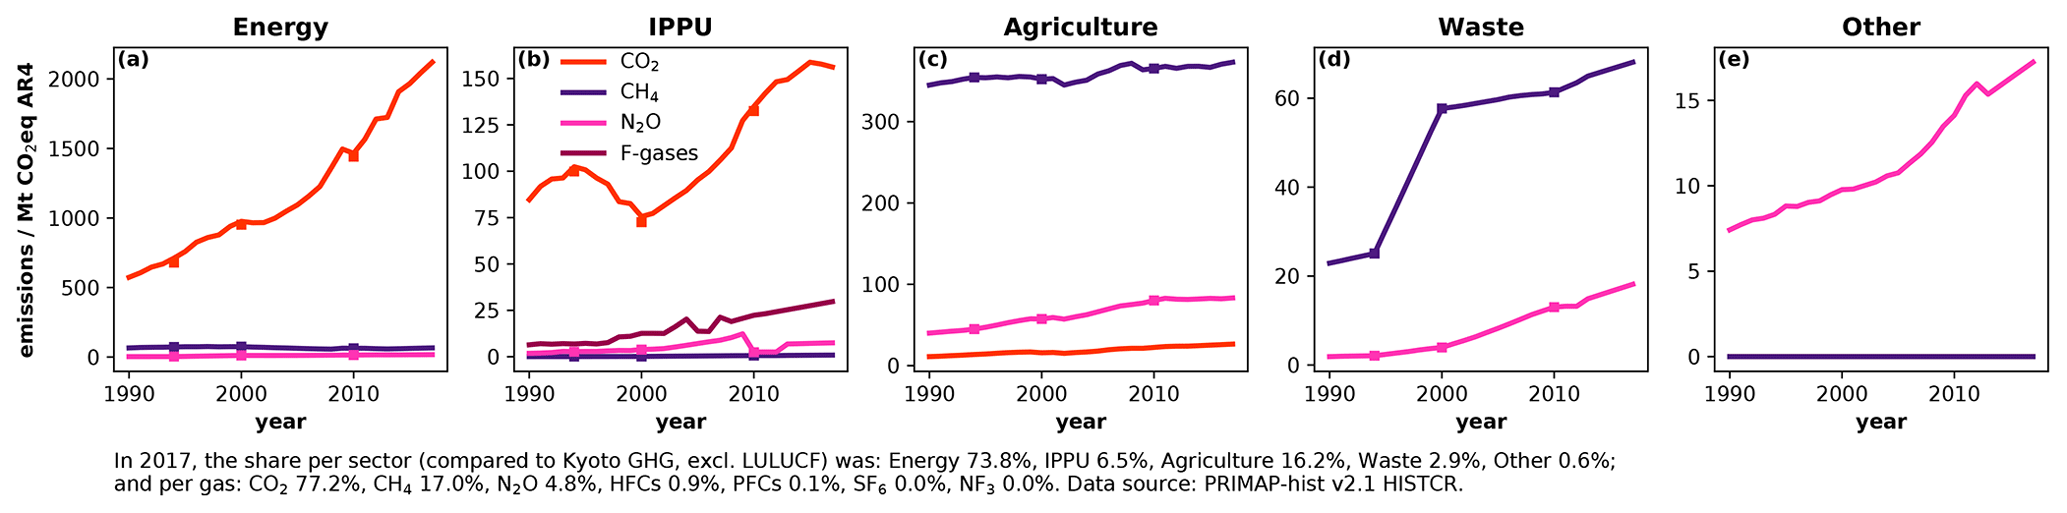
Figure 7India's historical emissions 1990–2017. Panels (a)–(e): emissions per main sector, split into the contributing Kyoto GHGs (CO2, CH4, N2O, and, in the case of IPPU, additionally F-gases as a total). Additionally, the share of per-sector and per-gas emissions in 2017 is presented compared to the national totals (Kyoto GHG excluding LULUCF; as text below the figure). Please note the different vertical axis limits. Data source: PRIMAP-hist v2.1 HISTCR. The raw country-reported data (UNFCCC 2019) are additionally presented as squares (no data available for the different F-gases).
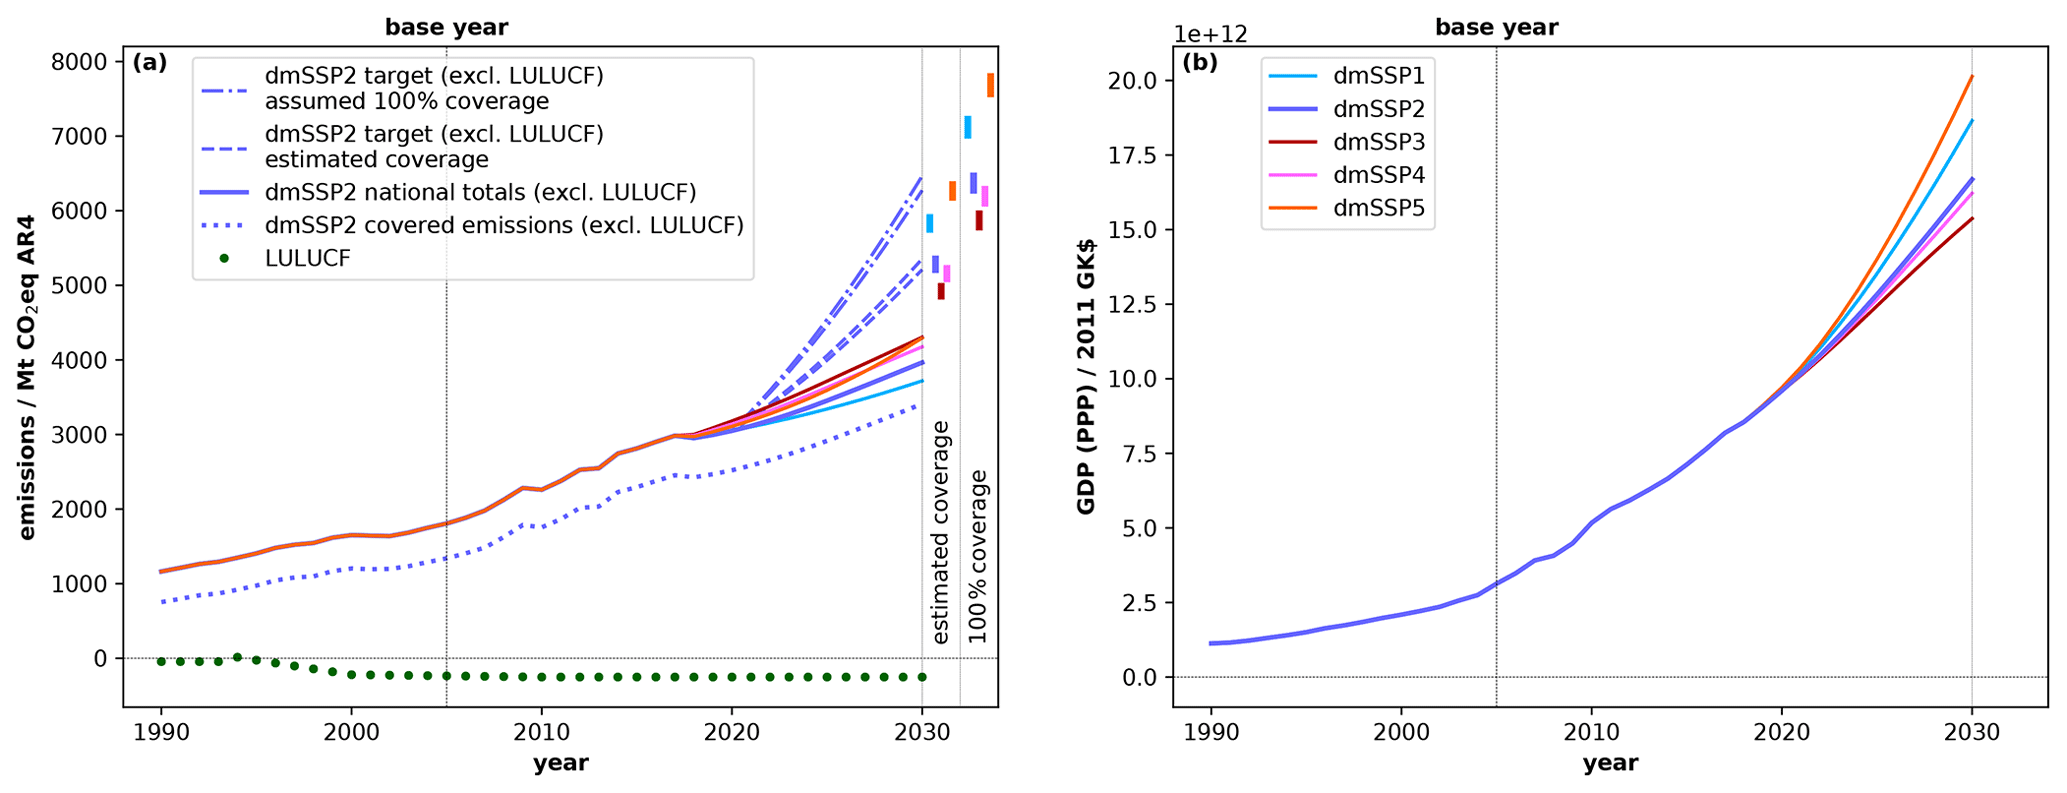
Figure 8Emissions (a) and GDP (b) time series for India. (a) Emissions from the downscaled SSP2 marker scenario (solid blue line), the corresponding covered share of emissions (dotted blue line), and LULUCF emissions (dotted green line, UNFCCC 2019; interpolated and extrapolated). NDC GHG mitigation target emissions (33 %–35 % reduction in emissions intensity per unit of GDP in 2030 compared to 2005) are shown for 2030 per SSP marker scenario. Quantifications based on an estimated coverage of 74 %/86 % in 2005/2030: “estimated coverage”. Based on an assumed coverage of 100 %: “100 % coverage”. All emissions exclude LULUCF (besides “LULUCF”). (b) GDP time series for the SSP marker scenarios (unit 2011 GK$: 2011 Geary–Khamis international dollars).
3.3 India's emissions intensity target: quantification and challenges
As an example of national target quantifications with NDCmitiQ, we present an analysis of parts of India's NDC. We show India as an example because several points made below are not specific to India's NDC but are of general interest and concern. In its NDC, India presents a GHG mitigation target of a 33 %–35 % reduction in emissions intensity per unit of GDP, with the chosen base and target years being 2005 and 2030, respectively (Republic of India, 2016). As India has only reported emissions data to the UNFCCC for 1994, 2000, and 2010, no data were reported for the chosen base year 2005, and the 1994 data were reported before the 1996 IPCC guidelines for national GHG inventories (IPCC, 1996) were introduced. While developed countries (Annex-I Parties) are obliged to submit annual GHG inventories to the UNFCCC, India, as a developing country, is not. Under the Katowice Climate Package (UNFCCC, 2019d), however, with self-determined flexibility, “Each Party shall report a consistent annual time series starting from 1990; those developing country Parties that need flexibility in the light of their capacities with respect to this provision have the flexibility to instead report data covering, at a minimum, the reference year/period for its NDC under Article 4 of the Paris Agreement and, in addition, a consistent annual time series from at least 2020 onwards” (II.E.3.57).
Table 5Quantification of India's emissions intensity target (REI). Input data for dmSSP2 and target equations (emiTargetinclLU and emiTargetexclLU) for 100 % coverage and estimated coverage (2005/2030: 74 %/86 %). LULUCF baseline emissions in 2005 negative; therefore, is not reduced or strengthened. Presented values contain rounding artefacts (results based on values with higher precision than the shown input data).
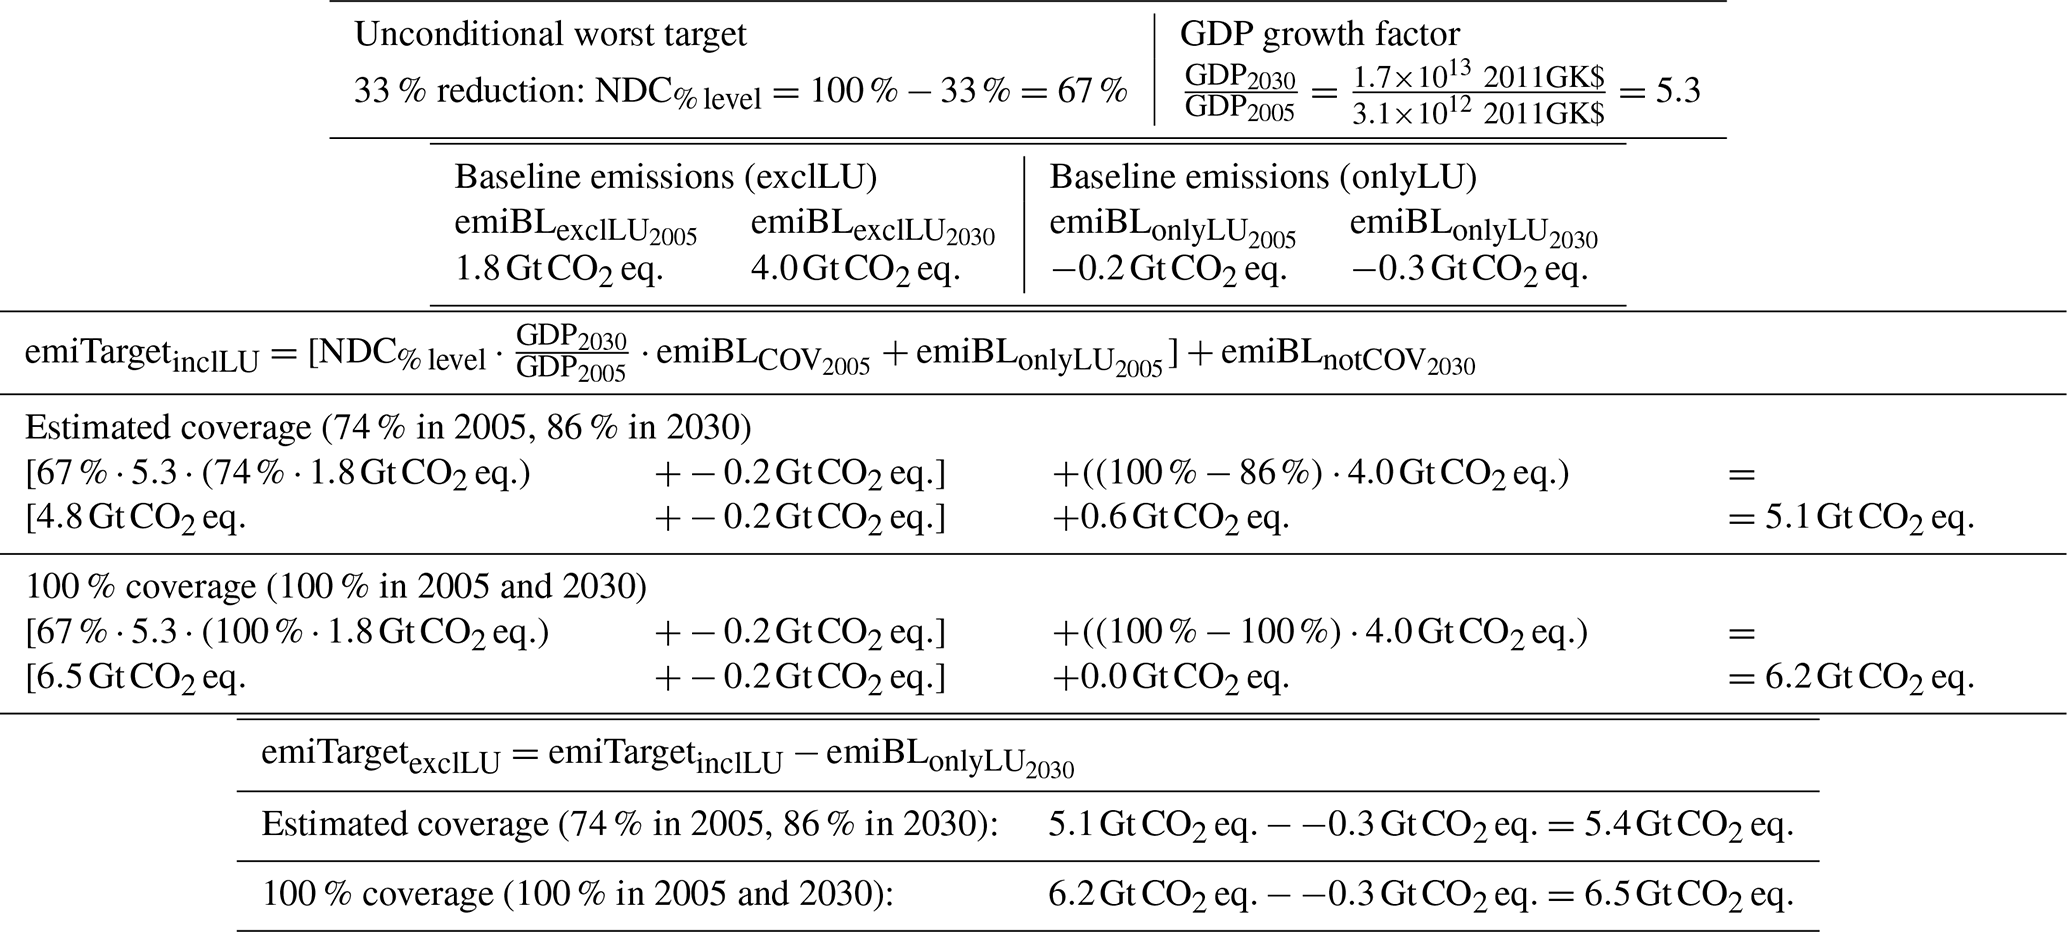
India does not clearly state the covered gases and sectors but rather gives measures for different sectors. We assessed the covered sectors to be Energy, IPPU, Waste, and LULUCF, and as no information is provided on the considered gases, CO2, CH4, and N2O are assumed to be covered, resulting in an estimated %cov of 74 %/86 % in 2005/2030 (excluding LULUCF compared to the dmSSP2 baseline emissions). India's total emissions in 2017 were 6.3 % of global Kyoto GHG emissions (excluding LULUCF and bunker fuels, based on PRIMAP-hist v2.1 HISTCR AR4). Figure 7 shows the importance of the covered CO2 emissions from the Energy sector (71 % of India's emissions in 2017) and the steady and steep increase over recent years. In the fiscal year that ended in March 2020, India's CO2 emissions fell by more than 1 %, for the first time in almost 4 decades, and this decline is not only caused by the Covid-19 lockdown, as it already started in early 2019 (Myllyvirta and Dahiya, 2020).
The target quantifications are based on the external data described in Sect. 2.2, as, besides an estimate of 2030 GDP, we did not find the necessary data in India's NDC. Together with the corresponding baseline emissions and GDP scenarios, quantifications based on dmSSP1–5 are compared, once for an assumed 100 % coverage and once based on the estimated %cov (Fig. 8). There are at least three interesting aspects.
- i.
The 2030 mitigation targets lie above the baseline emissions for all dmSSPs, mainly caused by the projected growth in GDP. India would overachieve the intensity target if the assumed baseline emissions were met, and there seems to be room for a more ambitious target than a 33 %–35 % reduction in emissions intensity per unit of GDP. The GDP-based downscaling of regional SSP emissions scenarios suggests that the targets could be more stringent. For the middle-of-the-road scenario dmSSP2, India's GDP is assumed to increase by a factor of approximately 5.3 from 2005 to 2030. India provides an estimate of its 2014 and 2030 GDP at 2011–2012 prices (in trillion): USD 1.69 and 6.31 (Republic of India, 2016). This would constitute an increase by a factor of 3.7 from 2014 to 2030 and with linear approximation a 5.8 times rise from 2005 to 2030. Assumed linearity probably leads to an overestimation, and the factor is in line with the GDP growth factor of 5.3 from dmSSP2. The assumed baseline emissions also affect these findings, as, if we would assume significantly higher baseline emissions in 2030 than presented while not changing any of the remaining assumptions, the target emissions would no longer be above the increased baseline emissions.
- ii.
For the different dmSSPs, the order of targets from highest to lowest is dominated by the GDP growth factor and not by the increase in baseline emissions (more details in Sect. 3.4).
- iii.
The targets with assumed 100 % coverage are higher than with estimated coverages of 74 % in 2005 and 86 % in 2030 (details below).
The unexpected behaviour of the targets with an assumed coverage of 100 % being higher than the comparison with estimated %cov is, in a mathematical sense, a combination of two aspects: (i) the high projected GDP growth rate and (ii) the increase in the share of covered base year emissions (example for dmSSP2: equations and estimates in Table 5). When %cov increases, and therefore the first term of the equation for emiTargetinclLU increase, while the last term () decreases and reaches 0 Gt CO2 eq. for 100 % coverage. For India's target, the rise in the first term is not compensated for by the decline of the last term of the equation, leading to the observed higher target emissions for 100 % coverage. However, several aspects would work against this behaviour. If the projected GDP growth rate was significantly lower or the downscaled 2030 baseline emissions were significantly higher (GDP growth factor below 1.7 or reference emissions higher than 12 Gt CO2 eq. in this example), the behaviour would not occur, and moving towards 100 % coverage would result in lower target emissions that would lie below the 2030 baseline (REI_RBY with a growth factor of 1: same as RBY target). Furthermore, and importantly, if the target value (relative reduction in emissions intensity per unit of GDP) itself was strong enough and not weaker than the baseline assumptions, this behaviour would not occur, and at the same time the target emissions would not exceed baseline emissions (with numbers as in Table 5: with a 53 %/59 % reduction the target with estimated/100 % coverage, respectively, would be below the baseline, and with a 78 % reduction the 100 %-coverage target would be below the estimated-coverage target). No information on the part of national GDP corresponding to the different emissions sectors is included in the assessment of the covered share of emissions. Doing so can change the results, and nations should consider the emissions intensities of added sectors when updating targets to expand the scope of the pledges.
The results should not be misunderstood as a motivation not to move towards an economy-wide target and include all Kyoto GHGs and sectors in the mitigation target, as aimed for by the PA. Our findings rather show that while doing so, in some cases Parties need to assess whether they have to increase their reduction level simultaneously or move to a different target type overall to ensure the ambition is ramped up rather than lowered and point towards quantification challenges and target uncertainties. For a few other countries our results also show higher target emissions when shifting towards a 100 % coverage compared to the estimated coverage. The countries for which this happens for all five dmSSPs are India (REI), Uzbekistan (REI), Botswana (RBY), the Democratic Republic of the Congo (RBU), and Tajikistan (RBY). China's target (REI) is also higher for a 100 % coverage but only for dmSSP1 and dmSSP5, the scenarios with the highest projected GDP growth and smallest growth factor for national emissions per unit of GDP.
The coverage for India's mitigation target is prone to uncertainty, as it is not clearly communicated in the NDC and leaves room for interpretation. Based on India's NDC, we did not assess the Agriculture sector to be covered. The CAT (2019c) also assumes the Agriculture sector to be excluded based on the information on the 2020 pledges, “even though not mentioned in the NDC”, and Climate Watch (2020a) and the World Resources Institute (2020) state the “Sectors covered” as “Not specified; various sectors mentioned for mitigation and adaptation strategies such as energy, industry, transportation, agriculture, forestry, waste”. Consistent with our assessment of India's NDC, the NDC Explorer (Pauw et al., 2016) states “Not indicated” for “Mitigation focus areas: agriculture”, and for “Reducing non-CO2 gases” it indicates “Considered (CH4, N2O)”. As “GHG coverage”, the World Bank (2016) states “n/a”.
Another source of uncertainty is the conditionality of the target. India's NDC states “To mobilize domestic and new & additional funds from developed countries to implement the above mitigation and adaptation actions in view of the resource required and the resource gap” (Republic of India, 2016), and we classify it as unconditional even though it is unclear to us whether parts are conditional. Contrary to our assessment and the CAT (2019d), Climate Watch (2020a) and the World Resources Institute (2020) denote India's target as conditional.
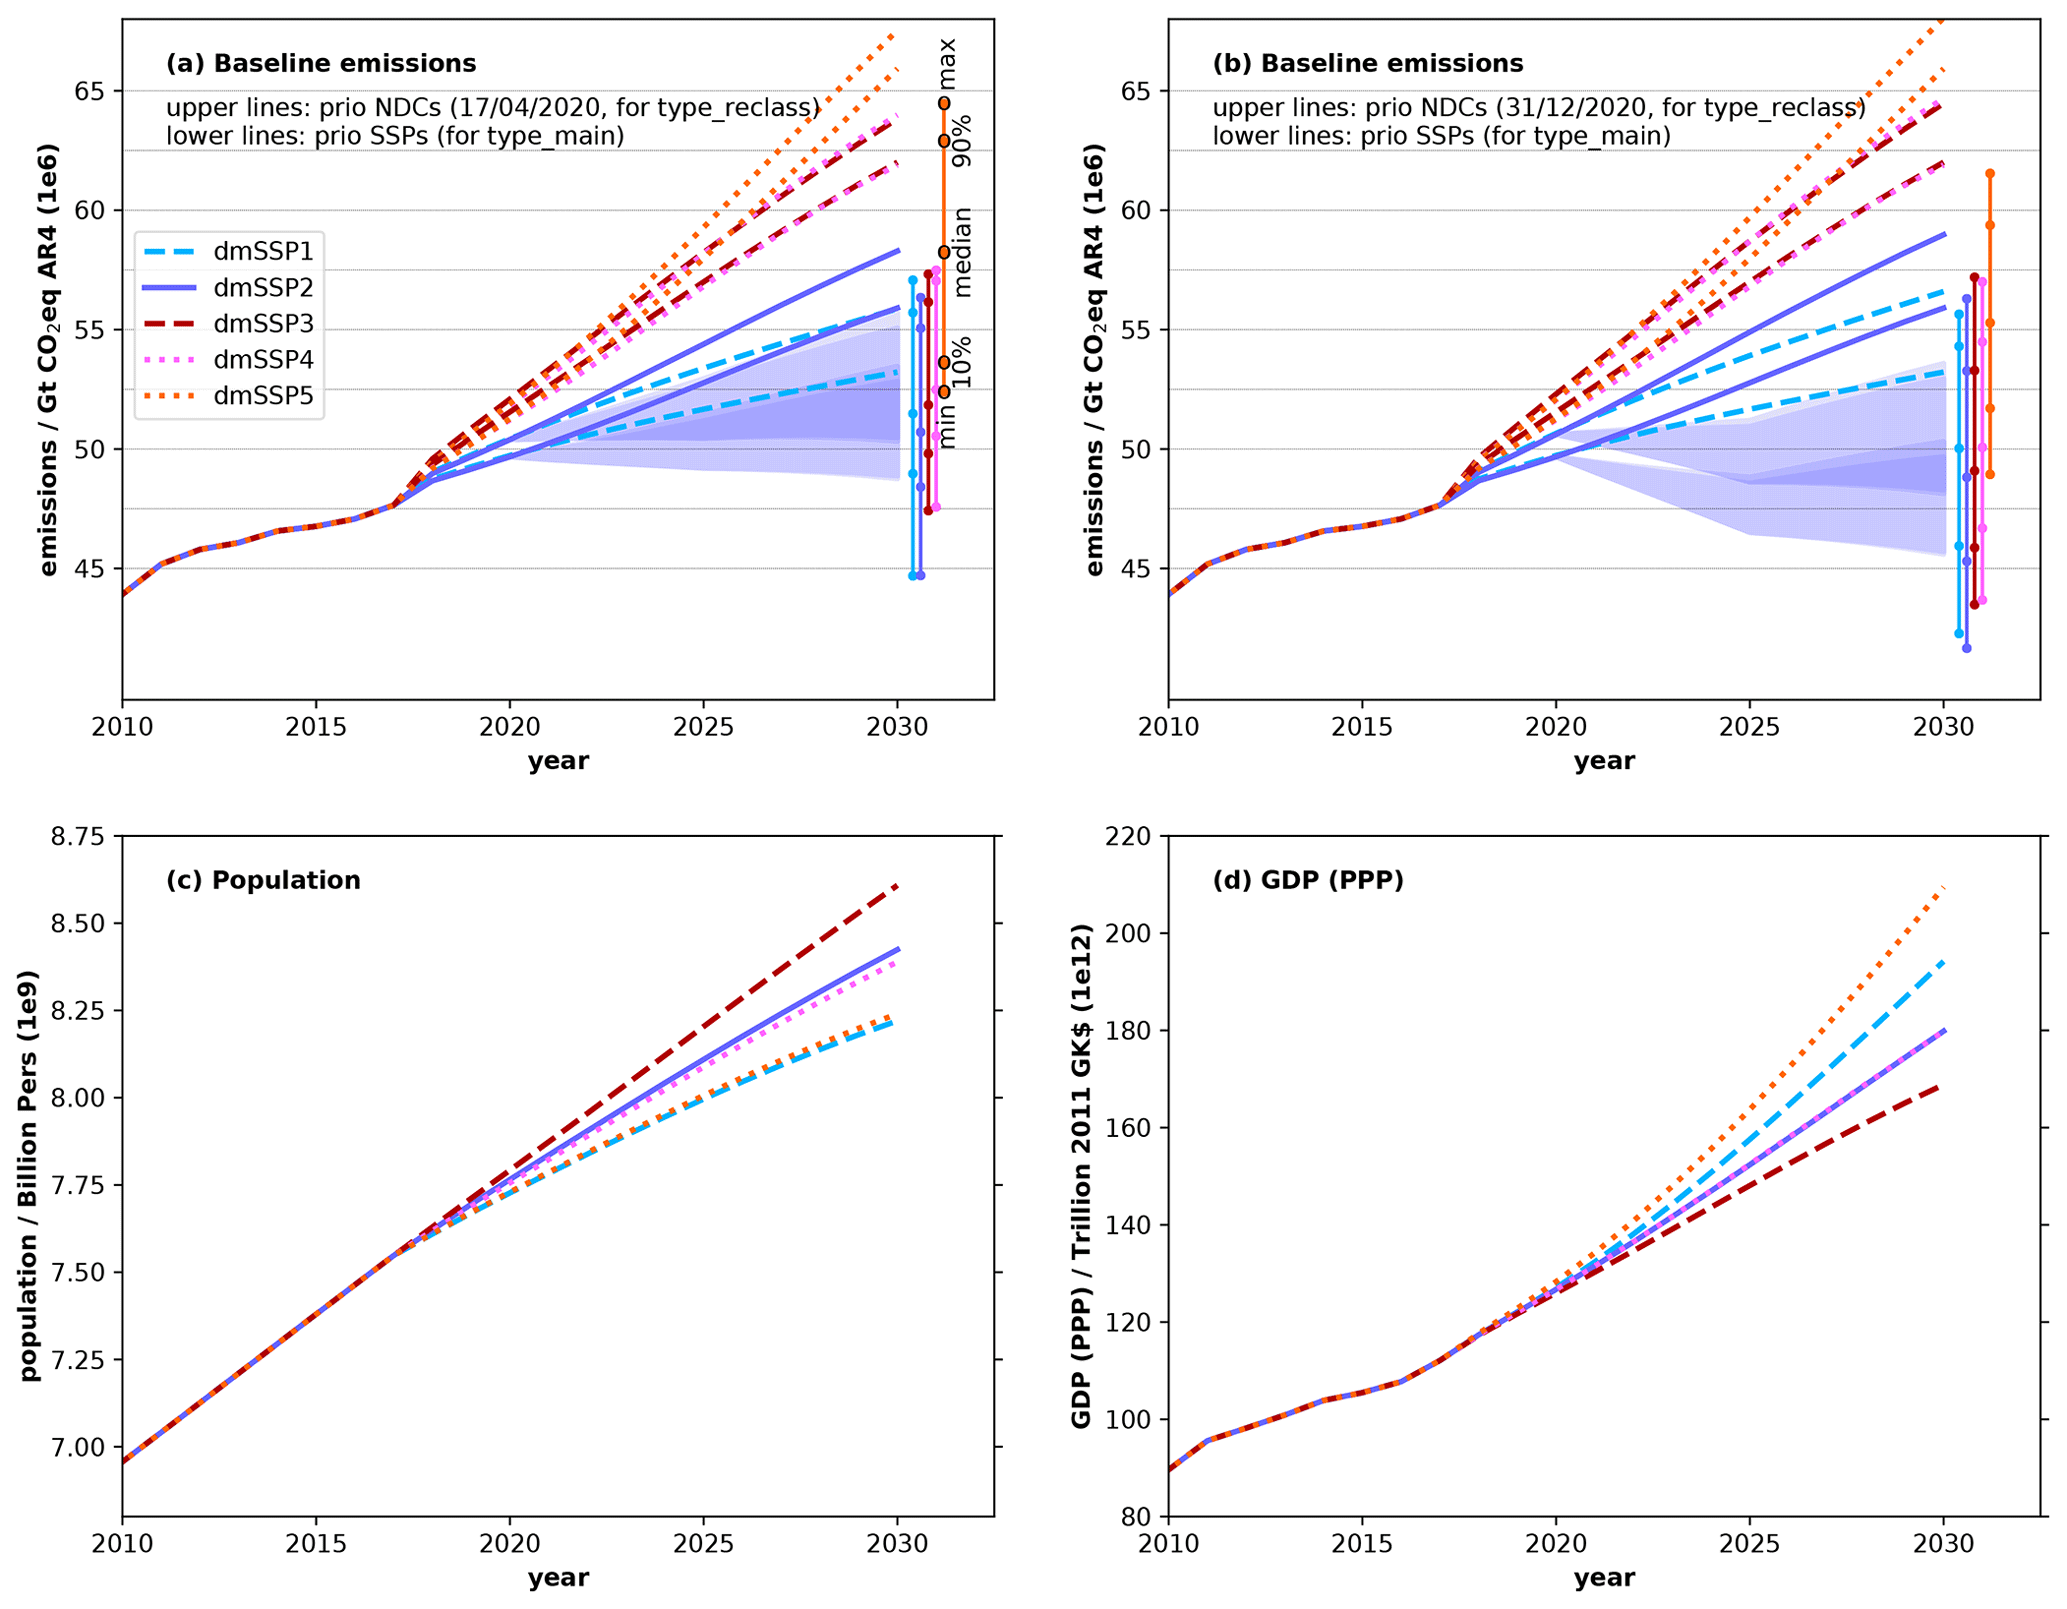
Figure 9(a, b) Global baseline emissions for dmSSP1–5. Shaded areas: emissions pathways for dmSSP2 (in Fig. 10: “default” with estimated or assumed 100 % coverage for “prio NDCs” and “prio SSPs”). (a) NDC submissions until 17 April 2020; (b) submissions until 31 December 2020. All emissions in (a) and (b) exclude LULUCF and bunker fuels. (c, d) Global pathways for the marker scenarios dmSSP1–5 baseline population and GDP. The range of mitigated 2030 emissions per SSP is given as a vertical line (0th (minimum), 10th, 50th (median), 90th, and 100th (maximum) percentiles of the data shown in Fig. 10).
Based on quantifications under dmSSP2 and an assumed 100 % coverage, India's emissions target ranges between 6.3 and 6.5 Gt CO2 eq. for emissions excluding LULUCF (6.0–6.2 Gt CO2 eq. including LULUCF; AR4). With estimated coverage of 74 %/86 % for 2005/2030, the quantified emissions target ranges between 5.2 and 5.4 Gt CO2 eq. for emissions excluding LULUCF (5.0–5.1 Gt CO2 eq. including LULUCF). The CAT (2019d) estimates the unconditional emissions intensity target to be in the range of 6.0–6.2 Gt CO2 eq. (excluding LULUCF, AR4). This value is a bit lower than our estimates when assuming a 100 % coverage. Climate Watch (2020a) and the World Resources Institute (2020) give a wider range of 5.9–9.1 Gt CO2 eq., not specifying whether these emissions include or exclude LULUCF. The exact reasons for the quantification discrepancies could not be assessed, but chances are higher that differences arise from assumptions of projected data than from historical data (LULUCF and non-LULUCF emissions, GDP). In the short term, India does not plan to raise the ambition of its NDC (Prakash Javadekar, minister of environment, forests and climate change: “The raising of ambition or ratcheting-up will arise only after a global stocktake in 2023.”, Gombar, 2020).
3.4 Global mitigation pathways
Some of the main outputs of NDCmitiQ are global emissions pathways consistent with the NDC GHG mitigation targets. Therefore, moving from example analyses of national targets and the underlying emissions data to global emissions, Figs. 9 and 10 show globally aggregated pathways resulting from a full implementation of the assessed targets from unconditional worst to conditional best and based on different input data and quantification options. First, the emissions data from the NDCs are prioritised (type_reclass), and second, the external time series are used (based on type_main). In the following, the mitigated emissions pathways under the five SSPs are named “NDCSSP”, while the baselines are named “dmSSP”.
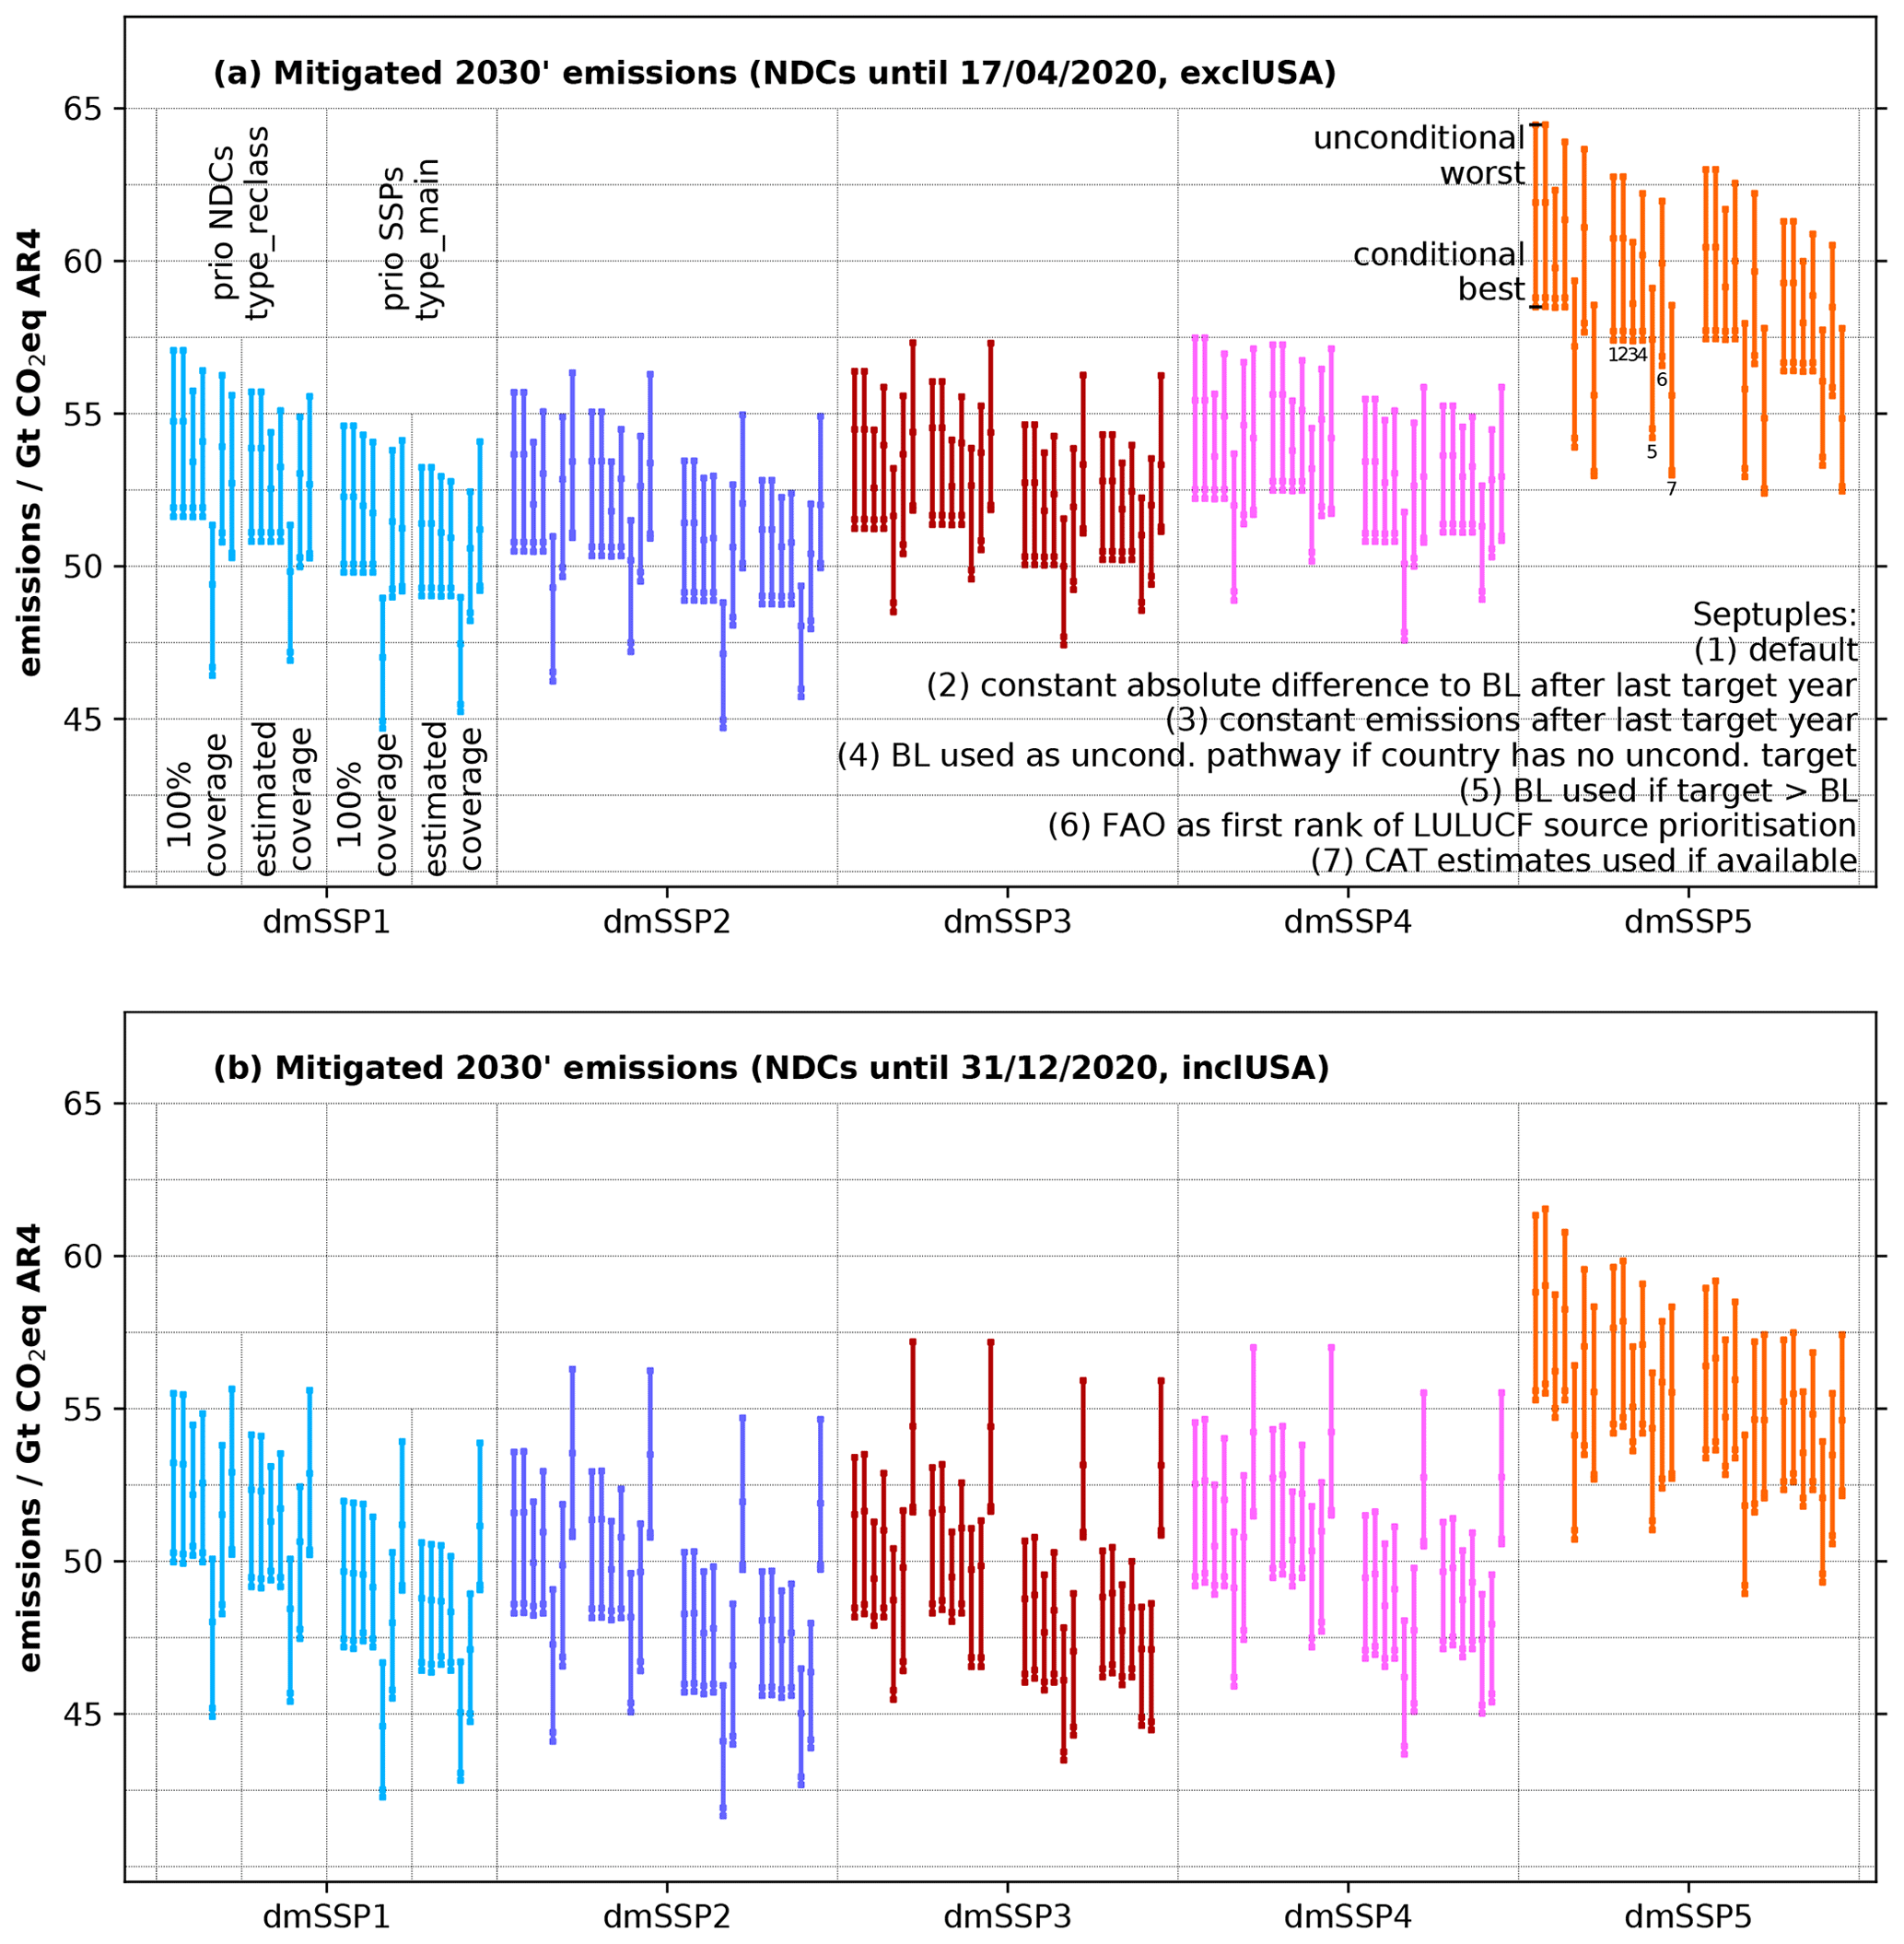
Figure 10(a, b) Estimates of mitigated emissions for 2030 based on the studied NDCs (a: NDCs submitted until 17 April 2020, b: 31 December 2020). Vertical lines: range of unconditional/conditional best/worst targets (conditionality and range indicated by squares). Results based on the following options (altering one option per quantification): “(1) default”: LULUCF data prioritisation CRF, BUR, UNFCCC, and then FAO and constant relative difference from baseline after last target year and conditional pathway used as the unconditional pathway if the baseline is below the conditional pathway (and the country has no unconditional target) and quantified target used even if it lies above the baseline; “prio NDCs”: prioritising NDC emissions data, based on type_reclass and the emissions described in Sect. 2.2.3; “prio SSPs”: based on type_main and the dmSSPs. (2) constant absolute difference from baseline after last target year; (3) constant emissions after last target year; (4) baseline emissions used as unconditional pathway if country has no unconditional target; (5) baseline emissions used if target lies above baseline; (6) FAO as first rank of LULUCF source prioritisation; (7) CAT estimates used if available. Emissions in (a)–(d) exclude LULUCF and bunker fuels.
First, we analyse the impact of the targets' conditionality and different scenarios for emissions, population, and GDP on the mitigation pathways. The higher aggregated emissions data from the NDCs for 2030 compared to the dmSSPs (Sect. 3.2) lead to higher global baseline emissions (difference between “NDC and SSP baselines”: dmSSP1–5 between 1.6 and 2.7 Gt CO2 eq. AR4) and consequently result in higher quantified mitigated emissions (NDCSSP1–5).
With our tool we confirm findings by Benveniste et al. (2018) that “the main sources of uncertainty is the range of ambitions given in NDCs, and the uncertainty on the economic growth of countries who expressed their target in terms of intensity”. In the presented quantifications for submissions until 17 April 2020, the conditionality range is 2.8–6.0 Gt CO2 eq. for all values displayed in Fig. 10 (difference between unconditional worst and conditional best; 31 December 2020: 2.9–6.1 Gt CO2 eq.) but with little difference between the conditional worst and best emissions.
For the different dmSSP scenarios, we observe a strong influence of the projected GDP on the global mitigation results. NDCSSP5 (fossil-fuelled development) has by far higher global emissions than NDCSSP1–4, which exceeds the difference between the dmSSP1–5 baseline emissions and results from the combination of high projected emissions baselines and GDP growth. NDCSSP1–4 are approximately in the same range, with the lowest mitigated emissions for NDCSSP2 (SSP2: often used middle-of-the-road scenario) even though its emissions baseline is not the lowest, and NDCSSP3–4 have the highest quantified mitigation impacts due to the lower GDP projections. We expect that the GDP effect would be less eminent if the energy mix targets for the large emitters China and India were included in the assessment, as the CAT assessed their energy targets to be the more stringent targets (CAT, 2020b, 2019d).
Only eight countries are assessed to have REI targets (relative reduction compared to emissions intensity), but amongst them are China and India. The REI countries represented 16 % of global emissions in 1990, but their share almost doubled by 2017 (35 %) and is projected to further increase to 38 % by 2030 (dmSSP2). Only the Dominican Republic chose its population and not its GDP as an emissions intensity reference. The influence of the underlying GDP data demonstrates the importance of reasonable estimates of GDP to quantify the mitigation targets. The results are also in line with Rogelj et al. (2017), who found the dominant driver of uncertainty in estimates of NDC mitigation levels on a global scale to be the potential variation in the underlying socioeconomic assumptions.
The global aggregates for the mitigated pathways are generally below the corresponding baseline emissions scenarios. However, for NDCSSP1, with the lowest baseline emissions but one of the highest GDP projections, this is not true (for unconditional worst). Higher mitigated than baseline emissions can result from all assessed target types excluding RBU and ABU. Reductions compared to BAU emissions in the target year will be below the baseline as long as the given NDC values are real reductions. Out of the presented runs, NDCSSP1 has the highest number of countries (23–29 countries for quantifications with 100 % or estimated coverage and type_main and type_reclass) for which the worst mitigated pathways are above the countries' baseline emissions.
The effects of different assumptions of underlying LULUCF baseline emissions on the target quantifications on a global scale are shown in Fig. 10. All emissions exclude LULUCF, but in many cases the targets exclLU have to be derived from targets inclLU (countries including LULUCF: Fig. A1), and therefore the LULUCF baselines often affect exclLU targets. As a default, LULUCF data from NDC, CRF, BUR, UNFCCC, and then FAO are prioritised. Prioritising FAO over CRF data leads to lower target emissions on a global scale, even though the global LULUCF emissions estimate for 2030 is +3.4 Gt CO2 eq. if FAO has the highest prioritisation, while it is a net sink of −2.2 Gt CO2 eq. for prioritisation of CRF data. This behaviour is not connected to certain target types, and we could not find a general pattern in the per-country changes that leads to this decrease in target emissions on a global scale. Fyson and Jeffery (2019) focused on the LULUCF component in NDCs and studied uncertainties due to NDCs' LULUCF contributions in a more refined way. They found that the ambiguity in the emissions reductions due to land-based activities results in ∼ 3 Gt CO2 yr−1 uncertainty in 2030, which is larger than their estimated total anthropogenic land use sink of −2 Gt CO2 yr−1 in 2030 and larger than the influence our choice of underlying LULUCF data has on the quantified targets (0.8 Gt CO2 eq. in global mitigated emissions exclLU for CRF vs. FAO).
To analyse their uncertainties, different options for the target and pathway calculations are implemented in NDCmitiQ. Focusing on the time period up to 2030, the effects of changing the options are generally smaller than the impact of conditionality and input data. For two options, the upper limit of the range between unconditional worst and conditional best estimates is reduced, while the lower limit is unchanged: option (4) using the baseline emissions as the unconditional pathway instead of the conditional pathway even if the baseline is lower than the conditional pathway (does not affect conditional pathways), or option (3) keeping the absolute emissions constant after a country's last target year instead of the relative difference from the baseline (only affects countries with a last target year before 2030). Especially option (3) has an increasing effect when assessing years after 2030, though, as for many countries the last target year is 2030. What has been observed for India's target in Sect. 3.3 – higher target emissions for 100 % coverage vs. estimated %cov – is seen on a global scale as well, as India and China have high national emissions and are amongst the few countries for which the target quantifications show this behaviour (China: only for dmSSP1 and 5). Option (5), in which the baseline is used instead of the quantified target if the country's mitigated pathway lies above the baseline in 2030, shows a relatively strong effect. Using this option in comparison with the default gives an impression of the countries' potential surplus emissions, an overachievement of their targets that some countries intend to sell internationally. For option (7), in which CAT estimates are used for all countries with data available instead of NDCmitiQ estimates, most of the quantification options only affect the remaining countries and the growth rates of the constructed country-level pathways, while the target estimates remain the same.
Depending on the quantification options and underlying dmSSP scenarios, global mitigated emissions under the NDCs in 2030 are estimated to range between 48.9 and 56.1 Gt CO2 eq. for 2030 (10th/90th percentiles for unconditional worst and conditional best estimates for dmSSP1–4, with median 51.8 Gt CO2 eq.; AR4, excluding LULUCF and bunker fuels). We do not consider dmSSP5 for these global estimates. For SSP5, the fossil fuel mobilisation in this high-emissions scenario is unprecedented (Bauer et al., 2017), and as pointed out by Hausfather and Peters (2020) from the SSPs, “SSP4-6.0 and SSP2-4.5 scenarios agree much better with near-term cumulative emissions than the SSP5-8.5 scenario” (here, the second number indicates a representative concentration pathway (RCP, van Vuuren et al., 2011) in the SSP–RCP framework). If we considered dmSSP5 as well, the range would amount to 49.0–58.0 Gt CO2 eq. with a median of 53.1 Gt CO2 eq. The presented estimates are based on NDCs submitted until mid-April 2020 unless stated otherwise. We recently also assessed the NDC updates up to the end of December 2020, which decreases our estimates to 45.6–54.1 Gt CO2 eq. with median 49.6 Gt CO2 eq. Both the 7.2 Gt CO2 eq. range (submitted December 2020: 8.5 Gt CO2 eq.) and absolute values are lower than the 56.8–66.5 Gt CO2 eq. yr−1 estimates by Benveniste et al. (2018) for 2030 (90 % confidence interval; 9.7 Gt CO2 eq. range; Table 6). However, adding to the difference is that their estimates include emissions from bunker fuels and probably LULUCF emissions, with “the share of international aviation and shipping in global emissions increas[ing] from 2.3 % in 2010 to 3.0 %–3.7 % in 2030” Benveniste et al. (2018). While they noted that essentially due to a range of GDP scenarios being considered instead of a single scenario the uncertainty range is larger than previous studies, the smaller range of 6.6 Gt CO2 eq. yr−1 for the SSP2 OECD scenario is comparable to other estimates. With 4.6 Gt CO2 eq. our median range for dmSSP2 is smaller (submission December 2020: 4.6 Gt CO2 eq.). For 2030, the United Nations Environment Programme (2019) found the global emissions for unconditional NDCs to be 56 Gt CO2 eq. (54–60 Gt CO2 eq.; median and 10th/90th percentiles, probably including LULUCF and bunker fuels), and, for conditional NDCs, 54 Gt CO2 eq. (51–56 Gt CO2 eq.). Our estimates that exclude LULUCF emissions and bunker fuels are 54.6 Gt CO2 eq. for the upper edge (52.2–56.7 Gt CO2 eq., unconditional worst) and 50.3 Gt CO2 eq. (48.1–51.7 Gt CO2 eq.) for conditional best, representing a larger range (submitted December 2020: see Table 6).
Benveniste et al. (2018)Table 6Comparison of mitigated global emissions for the year 2030 with United Nations Environment Programme (2019) and Benveniste et al. (2018). “Current study”: estimates based on submissions until 17 April 2020 or 31 December 2020 are presented in italic or bold font, respectively. Benveniste et al. (2018) and their Supplement: “share of international aviation and shipping in global emissions increase from 2.3 % in 2010 to 3.0 to 3.7 % in 2030”; “International aviation emissions for 2030 are approximated to lie within a range of 906 to 1200 Mt CO2 yr−1 […]. International shipping emissions are based on projections […] resulting in a range of emissions of 940 to 1200 Mt CO2 eq. yr−1 in 2030”. United Nations Environment Programme (2019): “[…] with international transport (aviation and shipping) representing around 2.5 % of GHG emissions [in 2018, excluding LUC]”.
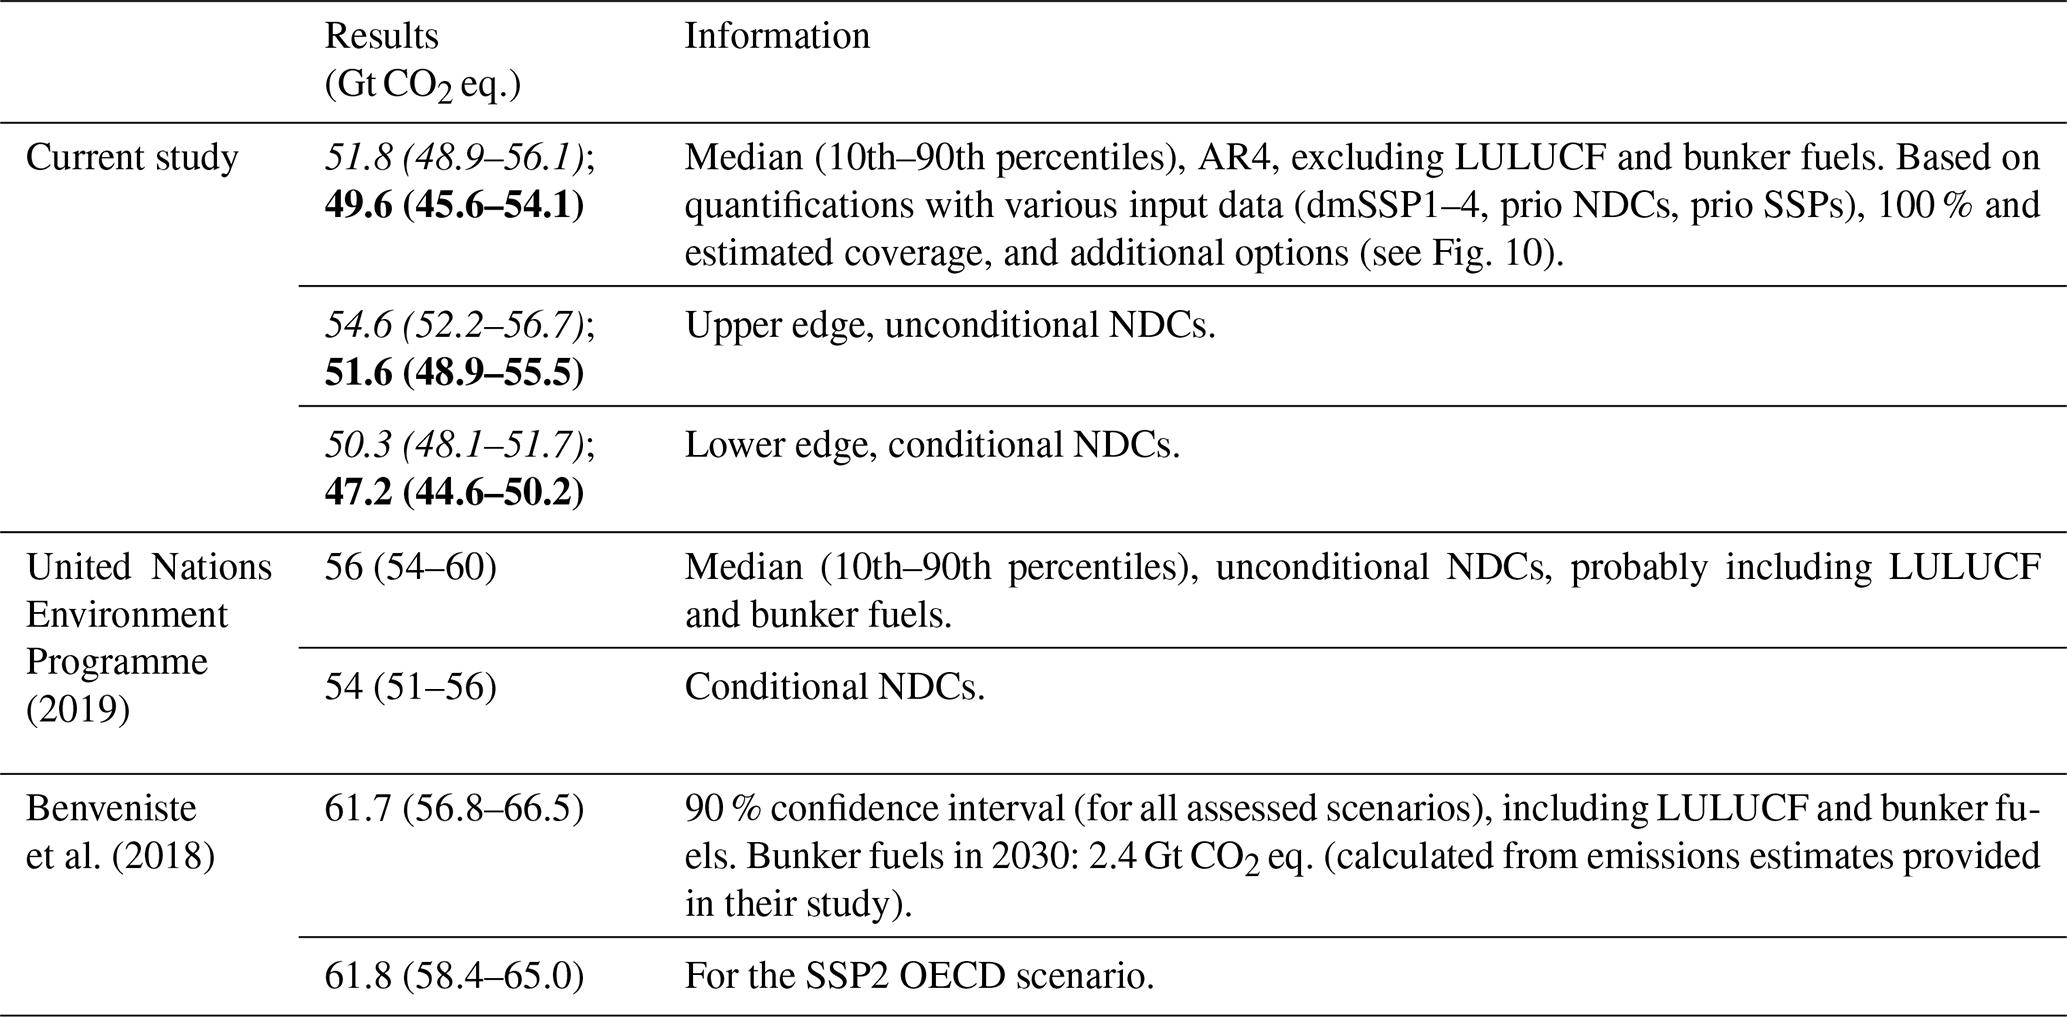
3.5 Other possible use cases
Additional use cases of NDCmitiQ and its output data include climate change impact assessments based on the global emissions pathways, calculation of mid-century targets, analyses similar to Fig. 10 but on a regional level with a refined view of target types or by changing several calculation options at a time to estimate interactions, effect of uncertainties in historical emissions, comparisons with the allowable carbon budget for the PA temperature goals, and estimation of end-of-century temperature rise.
One area of interest is the change in a country's mitigation targets and ambition level over time. Even though many assumptions and input data are required to run NDCmitiQ, it is possible to track progress on a country level. To do so, one can keep all settings unchanged but one. For example, we can run the tool with a defined emissions baseline for a certain country and then change this baseline while keeping the remaining input and settings the same, rerun the tool, and compare this country's resulting target estimates or mitigation pathway but also the changes on a global scale. The same is possible for i.a. a change in the relative pledged reduction or the target type. Also for this purpose, NDCmitiQ holds the option of defining a certain date up to which NDC submissions should be considered (“submissions_until”). When selecting 31 December 2020, per country the most recent NDC up to this date is considered. Therefore, with NDCmitiQ it is possible to track the global mitigation progress.
To estimate the global temperatures for the year 2100 based on NDC mitigation pathways, in comparison with pre-industrial times, the aggregated emissions pathways can be used in combination with additional tools. The emissions time series can be extended to 2100 using the pathway extension by Gütschow et al. (2018), and the Kyoto GHG basket emissions can then be split into multi-gas pathways in the equal quantile walk (Meinshausen et al., 2006). These multi-gas emissions pathways are input needed to derive estimates of the probabilistic global mean temperatures by running the simple climate model “Model for the Assessment of Greenhouse Gas Induced Climate Change” (MAGICC; Meinshausen et al., 2011).
This paper shows the methodology behind NDCmitiQ and possible use cases of this newly available open-source tool to quantify and analyse national GHG mitigation targets, as stated in the assessed set of NDCs, and construct corresponding national and global emissions pathways. NDCmitiQ is fast-running and incorporates a large amount of information retrieved from NDCs. It has a uniform approach with flexible input data for comparison studies but also provides target quantifications based on the available emissions data in NDCs whenever possible. As the presented time series of emissions, population, and GDP data currently implemented in NDCmitiQ are not intended to be exclusive, users can add other suitable time series for the quantifications. We believe that NDCmitiQ can help researchers and stakeholders for fast analyses when updated NDCs are submitted or in the global stocktake. Stakeholders might depend on results and model output provided by researchers, as running the tool demands a certain level of technical expertise.
The 168 NDCs assessed in our study, with documents consisting of 3 to 83 pages and strongly differing content and clarity, often leave room for interpretation. The “clarity, transparency, and understanding” (Art. 4.8; UNFCCC, 2015) of mitigation targets in NDCs could be improved substantially by i.a. including estimates of the absolute target emissions, providing the underlying data, specifically specifying LULUCF emissions and targets in this sector, estimating the part of emissions targeted by mitigation measures in the base and target years, and providing information on what is expected to happen with the emissions from uncovered sectors and gases, giving information on the planned evolution of emissions after the last target year. Implementation of the Katowice Climate Package (UNFCCC, 2019d) will hopefully reduce some of these sources of quantification uncertainties. However, as the above-mentioned clarity is still missing in the studied set of NDCs, we addressed the corresponding challenges and uncertainties throughout this paper and provide possible quantification options in NDCmitiQ.
Advantages of the presented tool are e.g. that it can be updated easily upon submission of new NDCs and does not only provide estimates of regional/global emissions pathways, but also the national contributions and pathways. Furthermore, it can be run with different data sets of national emissions and socioeconomic data. We provide a consistent approach to quantify GHG mitigation targets with a very broad scope, addressing all NDCs submitted to the UNFCCC. Currently, for simplicity estimates of the covered share of emissions are based on the main sectors, but as some NDCs name e.g. only the sub-sector “Electricity Generation” to be targeted and not the entire Energy sector, refinements could be implemented. Similarly to Benveniste et al. (2018), targets for fossil fuel shares are not included in NDCmitiQ, and the non-fossil fuel targets the large emitters China and India stated additionally to emissions intensity targets are not quantified. The CAT addresses these targets for China and India, and in the case of China for 2030, the total “NDC” range is estimated as 13.744–15.194 Gt CO2 eq., while the “Carbon intensity target[s]” range is higher (14.439–16.883 Gt CO2 eq., CAT, 2020b). For India in 2030, the presented “NDC: 40 % non-fossil capacity” target is 4.912 Gt CO2 eq., while again the “NDC: emissions intensity of GDP” is higher and ranges between 6.034 and 6.203 Gt CO2 eq. (CAT, 2019d). In NDCmitiQ, we currently do not have the means to address these additional energy-related targets or do policy analyses for all countries covered in NDCmitiQ. The CAT shows these targets to result in lower emissions than the emissions intensity targets, which indicates that our estimates might be at the high end of NDC-based emissions estimates. In line with these challenges, we might overestimate the influence of GDP projections we find on the globally aggregated mitigation pathways in total numbers if China's and India's energy-related targets are the more stringent targets as shown by the CAT and if these are the targets we can expect the two countries to reach by 2030. Estimates of the international bunker emissions and their planned mitigation are not addressed in NDCmitiQ. We restricted our uncertainty analysis on a global scale to a limited set of options, generally changing one option at a time, to be able to trace back the changes to the single options. However, this analysis can be further extended to address the interaction between the options and quantify the resulting uncertainty range.
NDCmitiQ is limited in its capabilities to quantify NGT targets. For countries with this target type, the assumed mitigated emissions trajectory equals the baseline pathway. Only if the reclassified target type differs from NGT will the mitigated trajectory in NDCmitiQ differ from the reference emissions. In total, for 2017/2030 (dmSSP2) 5.5 %/6.1 % of global emissions were emitted by countries classified as NGT (type_main). For type_reclass, the global shares are reduced to 3.5 % and 3.8 % for 2017 and 2030, respectively. Additional analyses and support for these NDCs would be beneficial for an improved quantification of the global mitigated emissions pathways. About 1 % of 2017 emissions was emitted by countries without NDC, to which we here add the contribution by the USA (approximately 14 %), who for a certain time withdrew from the PA (all emissions excluding LULUCF and bunker fuels). As for Parties with NGT targets, the baseline emissions are likewise assumed to be the mitigated trajectories for countries without NDCs.
In the Paris Agreement, it was decided that all countries should move towards economy-wide targets and raise their ambition over time. Based on the presented analyses, a total of 77 % of global 2017 emissions are estimated to be covered by the NDCs (excluding LULUCF and bunker fuels). As one of six countries, we assess that with the tested emissions and GDP scenarios, India's GHG mitigation target would show an unexpected behaviour when moving from the current estimated coverage towards a 100 % coverage without simultaneously increasing the relative reduction level: it would result in a less ambitious target with a noticeable impact on the global scale.
Countries can use fixed baselines, which do not change over time and facilitate target and pathway quantifications (Graichen et al., 2018) but which also leave room for overestimation or underestimation, as, in contrast to dynamic baselines, the projected pathways are not adapted to parameter or methodology changes over the years. On a global scale, for all historical years the baseline emissions data provided in the NDCs are lower than emissions from PRIMAP-hist, while for the year 2030 we find that they are +35 %/+98 % (exclLU/inclLU) higher than the middle-of-the-road scenario dmSSP2. For a total of 97 countries (excluding the USA) we were able to estimate targets based on NDC emissions data and classify 77 NDCs as RBU targets (relative reduction against BAU emissions; target_orig), out of which 17 could not be quantified with NDC emissions data.
For the tested quantification options, our range of global mitigation pathways is dominated by the targets' conditionality and the underlying emissions and GDP data. Supporting findings by Benveniste et al. (2018) and Rogelj et al. (2017), we see a clear influence of the assumed GDP, dominated by the fact that India and China pledged to reduce their emissions intensity per unit of GDP. In total, the analysed unconditional worst to conditional best emissions pathways differ by about 3.5–5.2 Gt CO2 eq. in 2030 (10th/90th percentiles for dmSSP1–4, median: 4.3 Gt CO2 eq.). The effect of different quantification options, such as the covered share of emissions, or the evolution of emissions after the last target year (tested up to 2030) has a smaller impact on the global scale. For the presented input data and quantification options, we estimate the global mitigated emissions in 2030 to range between 48.9 and 56.1 Gt CO2 eq. AR4 for dmSSP1–4 (10th/90th percentiles, median: 51.8 Gt CO2 eq., excluding LULUCF and bunker fuels; submissions until 31 December 2020 considered instead of 17 April 2020: 49.6 Gt CO2 eq. (45.6–54.1 Gt CO2 eq.)).
Under the Paris Agreement, Parties agreed to limit global warming to 1.5–2 ∘C, but studies show that the set of NDCs does not put us on track to reach this temperature goal. The quantification of GHG mitigation targets is ongoing research, as Parties are expected to regularly submit updated NDCs. The new open-source tool NDCmitiQ can be used for target quantifications and to derive national and global emissions pathways consistent with the NDCs. The emissions pathways can serve as a basis for estimating i.a. the 2100 temperature rise. To get a better picture of the range of possible outcomes from a full implementation of the NDCs, it is an advantage that various institutions quantify the mitigated emissions, as they include uncertainties and often result in an estimated emissions range. Examples of uncertainties are addressed in NDCmitiQ and presented in the paper, such as the conditionality of targets, the underlying emissions estimates and socioeconomic data, the share of national emissions covered by an NDC, or uncertainties from LULUCF. More clarity in the NDCs on the described issues would narrow down the range of quantified national and global mitigated emissions, here estimated to range between 48.9 and 56.1 Gt CO2 eq. AR4 in 2030 for SSP1–4 (10th/90th percentiles, median: 51.8 Gt CO2 eq., excluding LULUCF and bunker fuels; submissions until 31 December 2020 considered instead of 17 April 2020: 49.6 Gt CO2 eq. (45.6–54.1 Gt CO2 eq.)).
In the Appendix, additional and explanatory information is given as referenced in the paper.
A1 Pre-processing of projected non-LULUCF emissions
Pre-processing of the five downscaled SSP marker scenarios (dmSSP1–5) is performed to fill missing time series for some countries (information for Sect. 2.2.1). For a few countries, data are not available for all five dmSSPs (emissions, population, and GDP: up to six countries, with a global share of up to 0.1 % in 2017), in which case the missing dmSSP is approximated as the mean time series of all available dmSSPs.
Up to 43 countries (depending on the scenario and entity) with very small emissions, population, or GDP have no downscaled time series available for dmSSP1–5, representing global shares of merely up to 0.2 %, 0.5 %, and 0.1 % in 2017, respectively. For these countries, estimates for future years are based on linear regression to the PRIMAP-hist data in 2012–2017.
Some countries only cover certain F-gases in their mitigation targets, and depending on the target type, we might need scenarios of the single contributions for the calculation of the covered share of emissions. As for dmSSPs, no information is available on the contribution of HFCs, PFCs, SF6, and NF3 to the total basket of F-gases; we base our estimates on the historical contributions (mean over 2012–2017).
A2 Emissions time series for LULUCF (non-NDC data)
The LULUCF data sources included in NDCmitiQ are prioritised as follows.
-
CRF 2019 and CRF 2018. Emissions data reported to the UNFCCC by former Annex-I countries (industrialised countries) in the Common Reporting Format (UNFCCC, 2019c, 2018; Jeffery et al., 2018a, b; Gütschow et al., 2020a). The year indicates the submission year.
-
BUR 3, BUR 2, and BUR 1. Emissions data reported to the UNFCCC by former non-Annex-I countries in their Biennial Update Reports (UNFCCC, 2019b). BUR 1 is the first and BUR 3 the most recent submission (if available).
-
UNFCCC 2019. National Communications and National Inventory Reports for developing countries (UNFCCC, 2019a).
-
FAO 2019. FAOSTAT database: Food and Agriculture Organization of the United Nations (FAO, 2019).
For some countries, only FAO or UNFCCC or CRF have LULUCF emissions data available, for other countries FAO and UNFCCC, or FAO and CRF, or FAO and BUR have data, while for others FAO and UNFCCC and BUR provide data. A country's LULUCF emissions time series from the chosen data source are interpolated linearly and then extrapolated constantly by the mean over 1990–1997 if backward extrapolation is necessary, and the mean over all data points starts in 2010 as projected LULUCF emissions. Regarding forward extrapolation, the approach is similar to one of the LULUCF scenarios in Fyson and Jeffery (2019), with the average over 2004–2014 in their case. Our LULUCF data time series do not take into account current or planned afforestation, deforestation, or reforestation. For some Parties, country-reported data have no values available between 1990 and 1997 or after 2009, and in these cases, extrapolation is based on the first/last available value only. Due to extremely scarce country-reported data availability in some cases, we chose to merely dismiss time series from a certain data source for a country if fewer than three data points are available for 1990–2017. However, if none of the other sources has at least three annual values available, the source with higher prioritisation is used nonetheless. This check does not consider whether available values differ on an inter-annual basis, so time series are not dismissed if they were interpolated beforehand. We use available Kyoto GHG emissions or the sum over the relevant gases in the LULUCF sector, CO2, CH4, and N2O (interpolation and extrapolation prior to aggregation).
CRF 2019 is chosen for 43 countries (−1822 Mt CO2 eq.; for 2017 and GWP AR4), BUR 3 for two countries (−102 Mt CO2 eq.), BUR 2 for seven countries (811 Mt CO2 eq.), BUR 1 for three countries (−7 Mt CO2 eq.), UNFCCC 2019 for 47 countries (−2975 Mt CO2 eq.), and FAO 2019 for 93 countries (2000 Mt CO2 eq.). As all countries with CRF 2018 data already submitted their CRF 2019 data, CRF 2018 is not actually used. However, for future updates, it makes sense to include the option to choose data from the previous year in case not all countries have submitted new data yet.
A3 Baseline emissions time series based on NDC data
We collected the emissions baseline data from within NDCs and classified them as excluding LULUCF, including LULUCF, and only LULUCF (exclLU, inclLU, onlyLU; details of Sect. 2.2.3). Additionally, based on these emissions and complemented by the PRIMAP-hist and dmSSP emissions, a data set of national emissions time series (exclLU) was constructed. To start with, the details on how we choose which LULUCF emissions to use for the target quantifications are given in Table A1.
Table A1Decision making on which emissions data to use for LULUCF. The following is checked in the presented order, and the first match is used as onlyLU emissions.
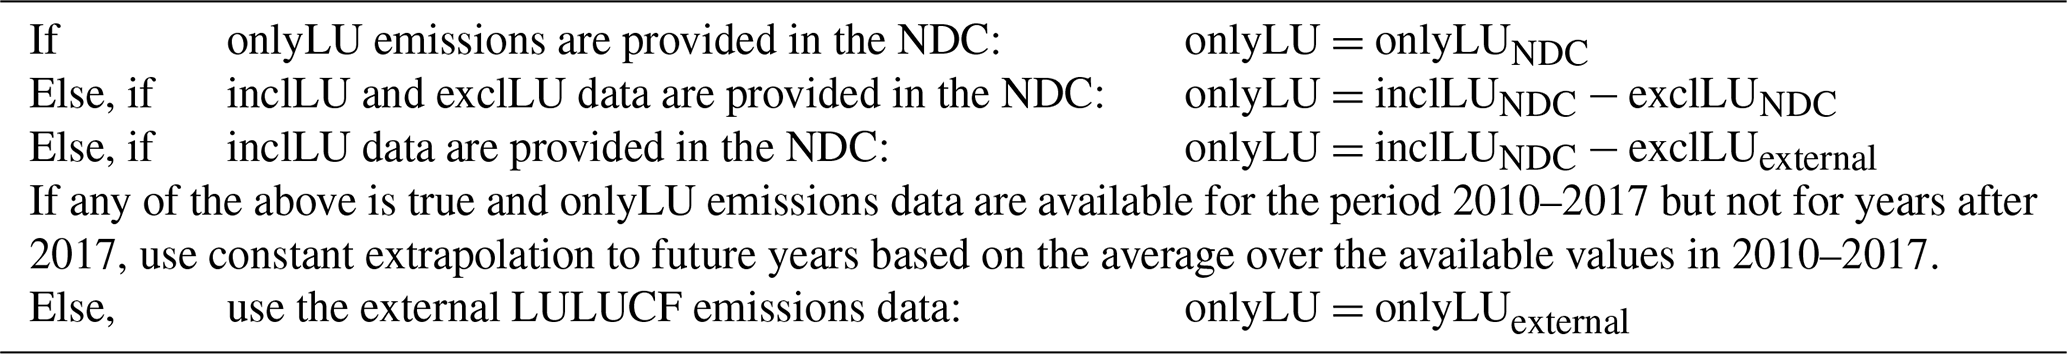
Table A2Details on the approach used to construct an NDC emissions data set (exclLU) for 1990–2050.
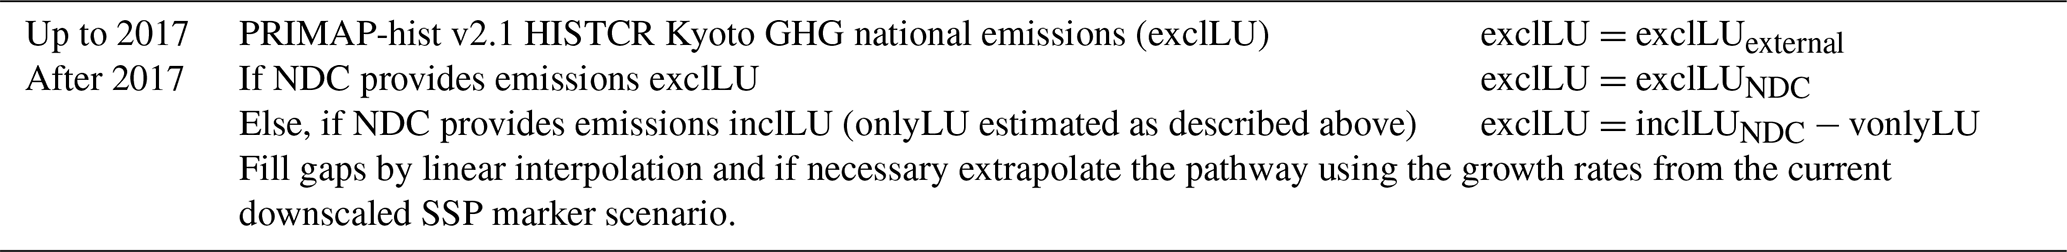
Table A3Input needed for the quantification of NDC GHG mitigation targets per target type. Some information or data can be retrieved from NDCs only (“NDC”), while for some data “external” sources can be used (indicated in column “Source”). “Coverage” can be the covered sectors and gases or numerical values for the share of national emissions affected by the mitigation target (for the base and target years). “(x)” indicates that the information is only needed for Parties that do not cover all of their national base year emissions.

To create mitigated emissions pathways, we intend to use target emissions that exclude contributions from LULUCF and construct a data set spanning 1990–2050 based on the data provided within NDCs, combined with the PRIMAP-hist and SSP emissions for completeness, which can then be used for pathway creation. The constructed data set is based on the PRIMAP-hist v2.1 HISTCR Kyoto GHG national emissions time series (exclLU) up to 2017, followed by the exclLUNDC emissions, with linear interpolation between 2017 and the available NDC data. If the last year of exclLUNDC is earlier than 2050, we use the dmSSP growth rates to extrapolate the emissions pathway, resulting in one constructed data set per dmSSP (further details in Table A2). Even though, up to 2017, the NDC data set is constructed with PRIMAP-hist emissions, the emissions given within NDCs are used to quantify their targets (for type_reclass) unless stated otherwise, e.g. for comparison runs (type_main).
Table A4How we define the share of emissions covered by an NDC (%cov, excluding LULUCF). “economy-wide” stated: all sectors (LULUCF treated separately) are assumed to be covered even if a list of covered sectors is given that is not complete. If in the NDC it becomes obvious, however, that the reduction merely applies to emissions from certain sectors, only these sectors are covered. Example of decision making from box 1+2 in Table A5 (Sect. A5).
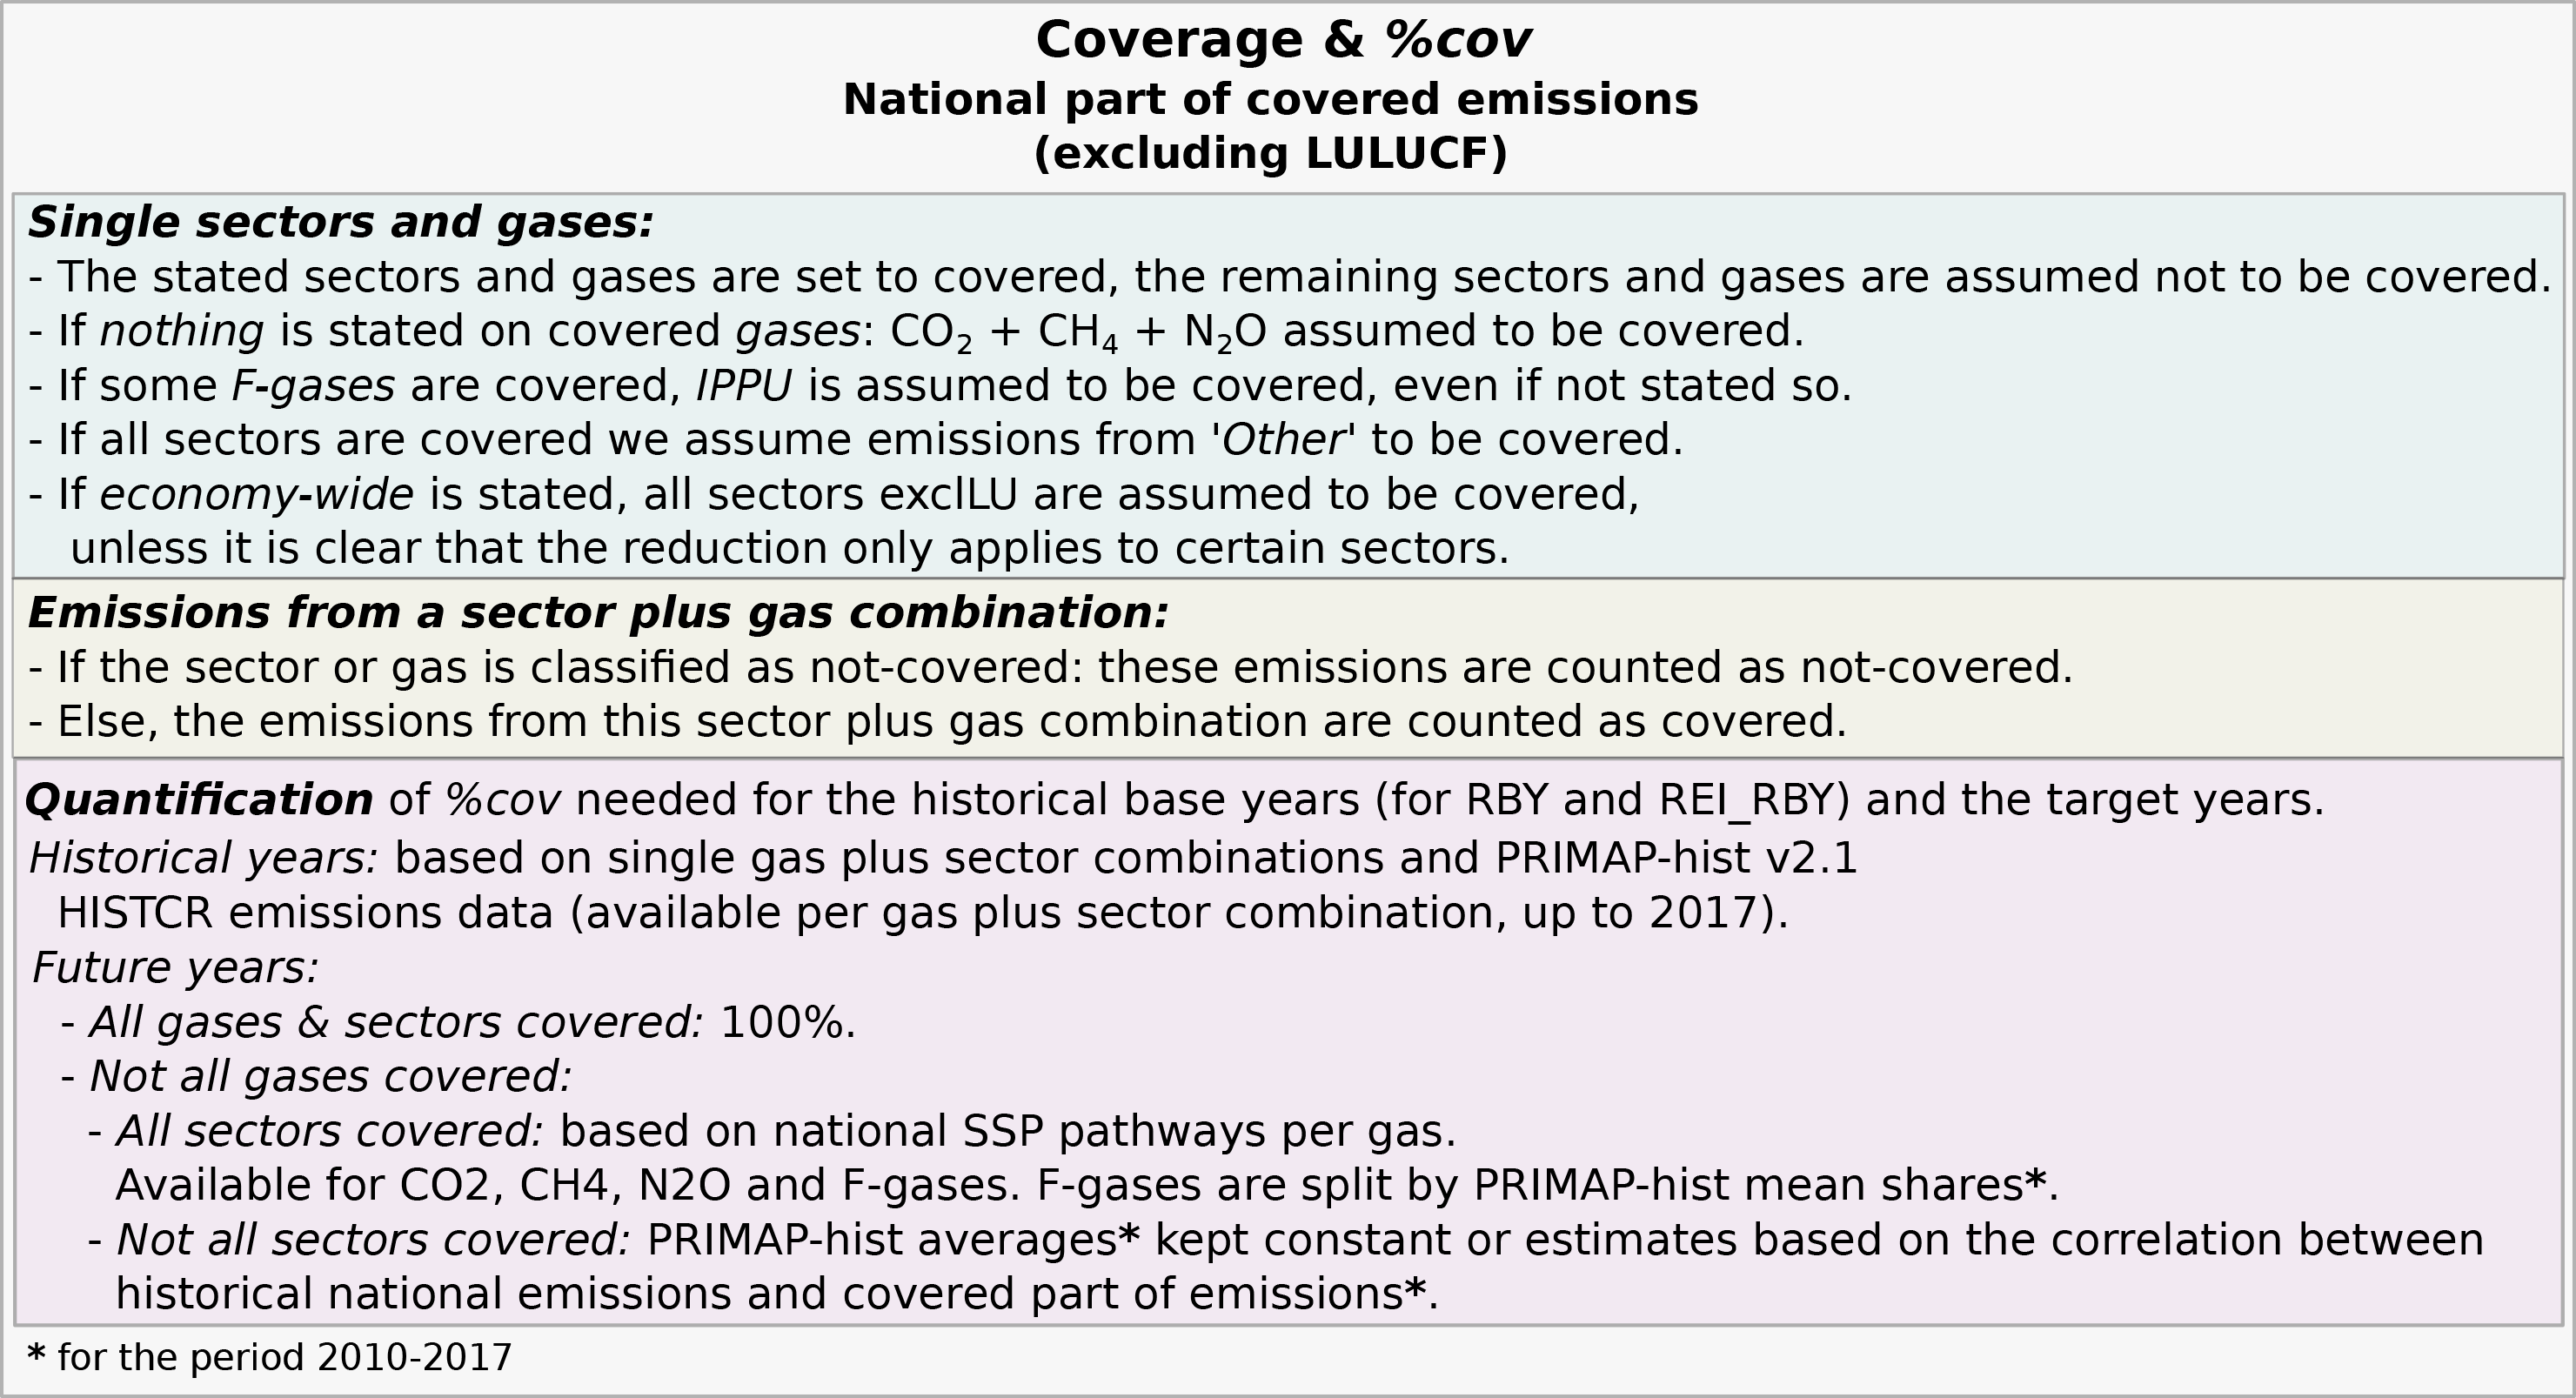
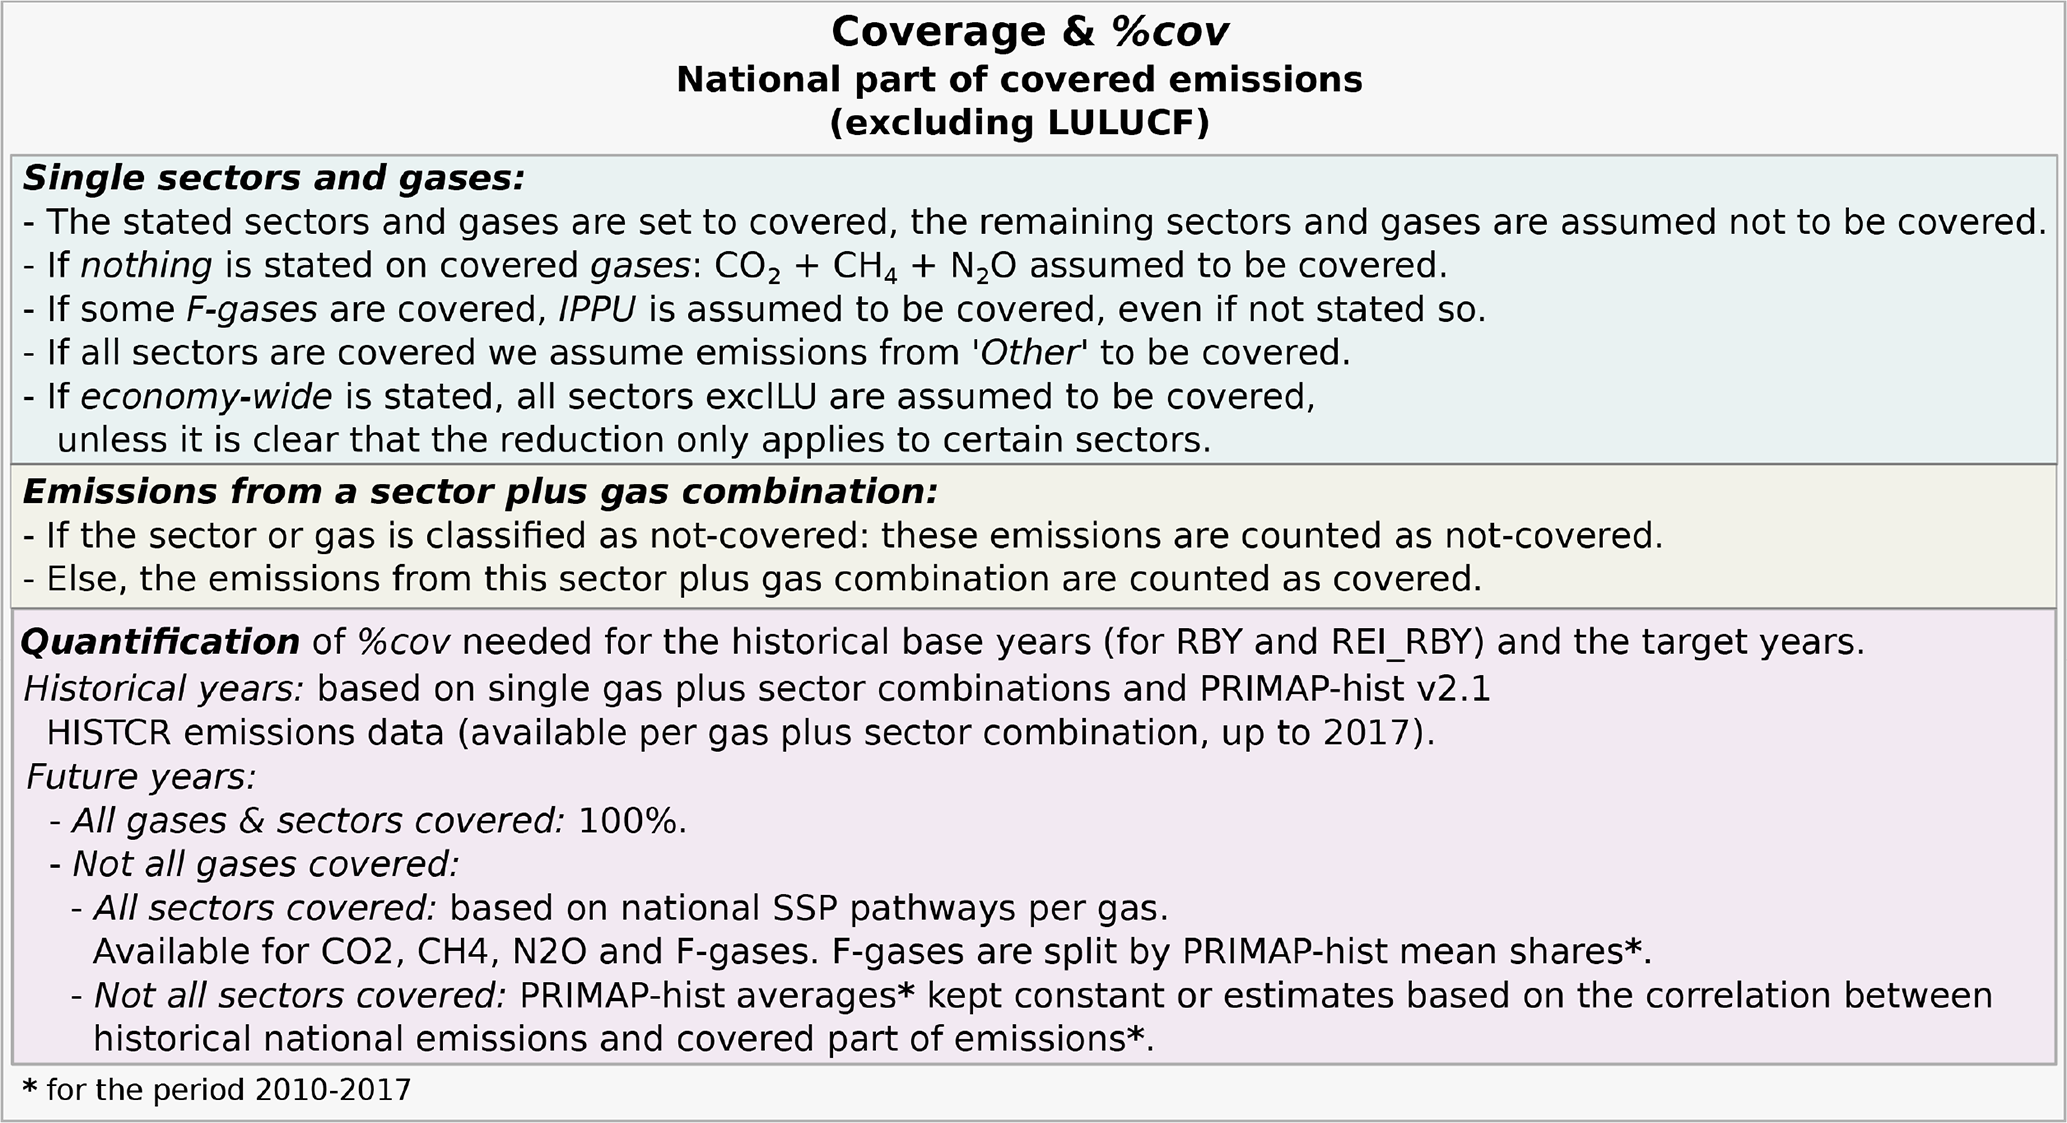
Table A5Decisions on covered sectors and gases. “+” means “covered”, “–” means “uncovered”, and “/” means “no information available”.
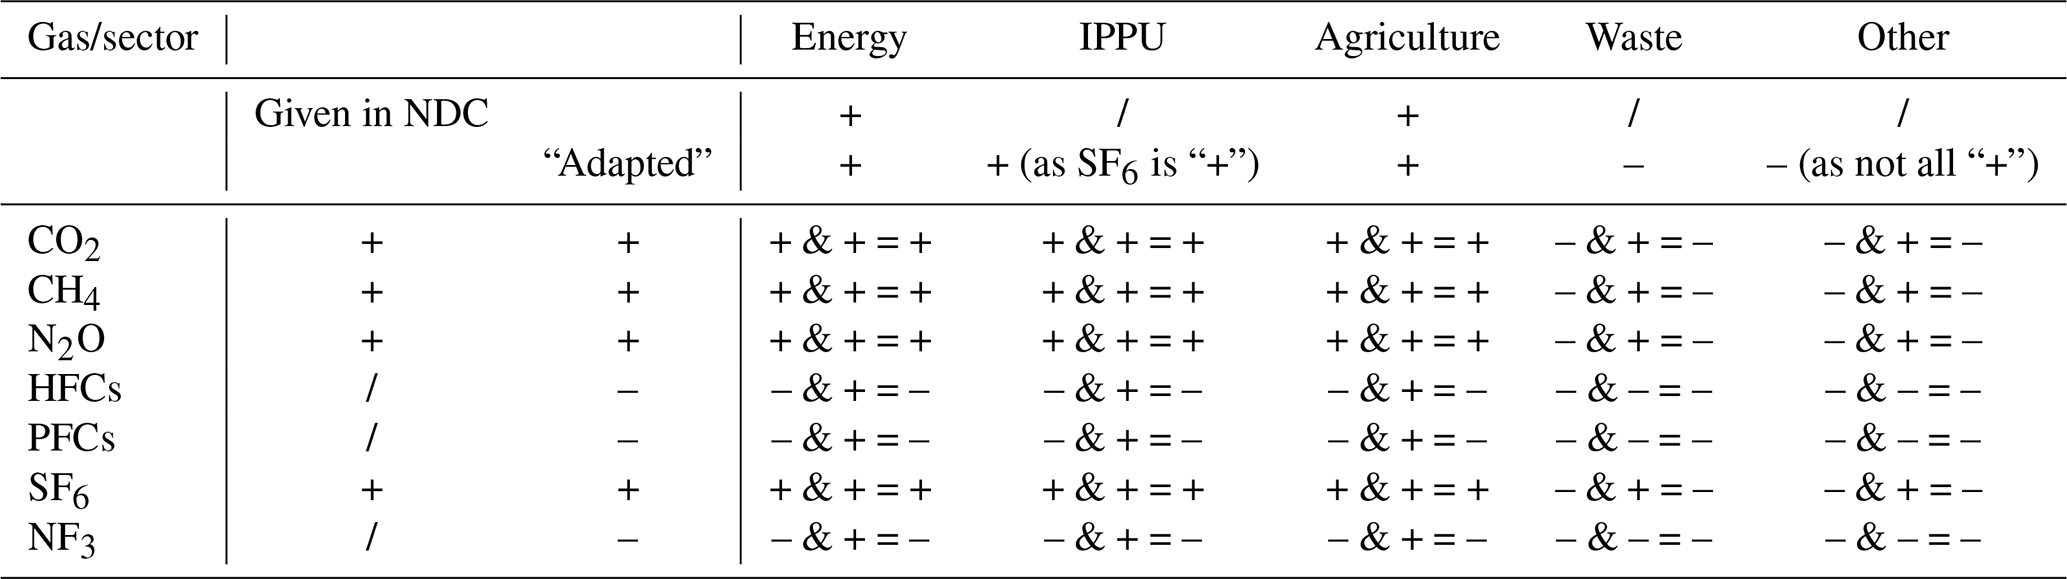
A4 Target type-dependent input data
In addition to Sect. 2.1.3, Table A3 gives a short overview of the input data needed for the quantification of the NDCs' mitigation targets per target type.
A5 Covered share of emissions
The quantification rules for the share of emissions covered by a Party's NDC GHG mitigation target (%cov, excluding LULUCF) are given in Table A4 (details for Sect. 2.3). In general, %cov is based on an assessment of the covered main sectors and GHGs and on PRIMAP-hist emissions data per sector and gas combination (years up to 2017). For the period after 2017, estimates are the average recent %cov or are derived from the correlation between covered and total national emissions (all for 2010–2017). The applied rules are further clarified in Table A5, and Fig. A1 contains per-country information of the covered sectors and gases. The coverage is presented as provided (more or less explicitly) in the NDCs and as “adapted” for use in NDCmitiQ. Results for %cov were used in Geiges et al. (2019), with small changes in the methodology since then.

Figure A1Sectors and Kyoto GHGs covered by NDCs on a per-country level. Crosses: ± explicitly mentioned coverage, squares: adapted coverage used in NDCmitiQ. EU target information: shown for single countries (e.g. Germany). The per-country share of global Kyoto GHG emissions is presented (for 2017, based on PRIMAP-hist v2.1 HISTCR, GWP AR4 excluding LULUCF, and bunker fuels). Shares displayed in green: target is intended to be economy-wide. NDC submissions until 17 April 2020.
Estimates of %cov for upcoming years, needed to define the (un)covered emissions share in the target years, are based on the decisions and quantifications outlined in Fig. A2. Either the average recent values of %cov are kept constant or estimates are calculated from the correlation between national total emissions and %cov (2010–2017). NDCmitiQ provides two options as a projection preference: “correlation” (default) or “mean”. The scheme presented in Fig. A2 describes the steps if the mean is chosen as a preference. For the option “correlation” the correlation is used for each country unless the r value of the regression line to the correlation is below a defined limit (0.85). If the correlation is used, the estimates of %cov depend on the projected national emissions and therefore on the chosen dmSSP scenario.
In Table A6, the national shares of emissions per sector/gas are given as 95th percentiles to reduce the influence of extreme values and missing data. Further, the number of countries assessed to cover emissions from a certain sector/gas are provided. The information is complementary to Table 3.
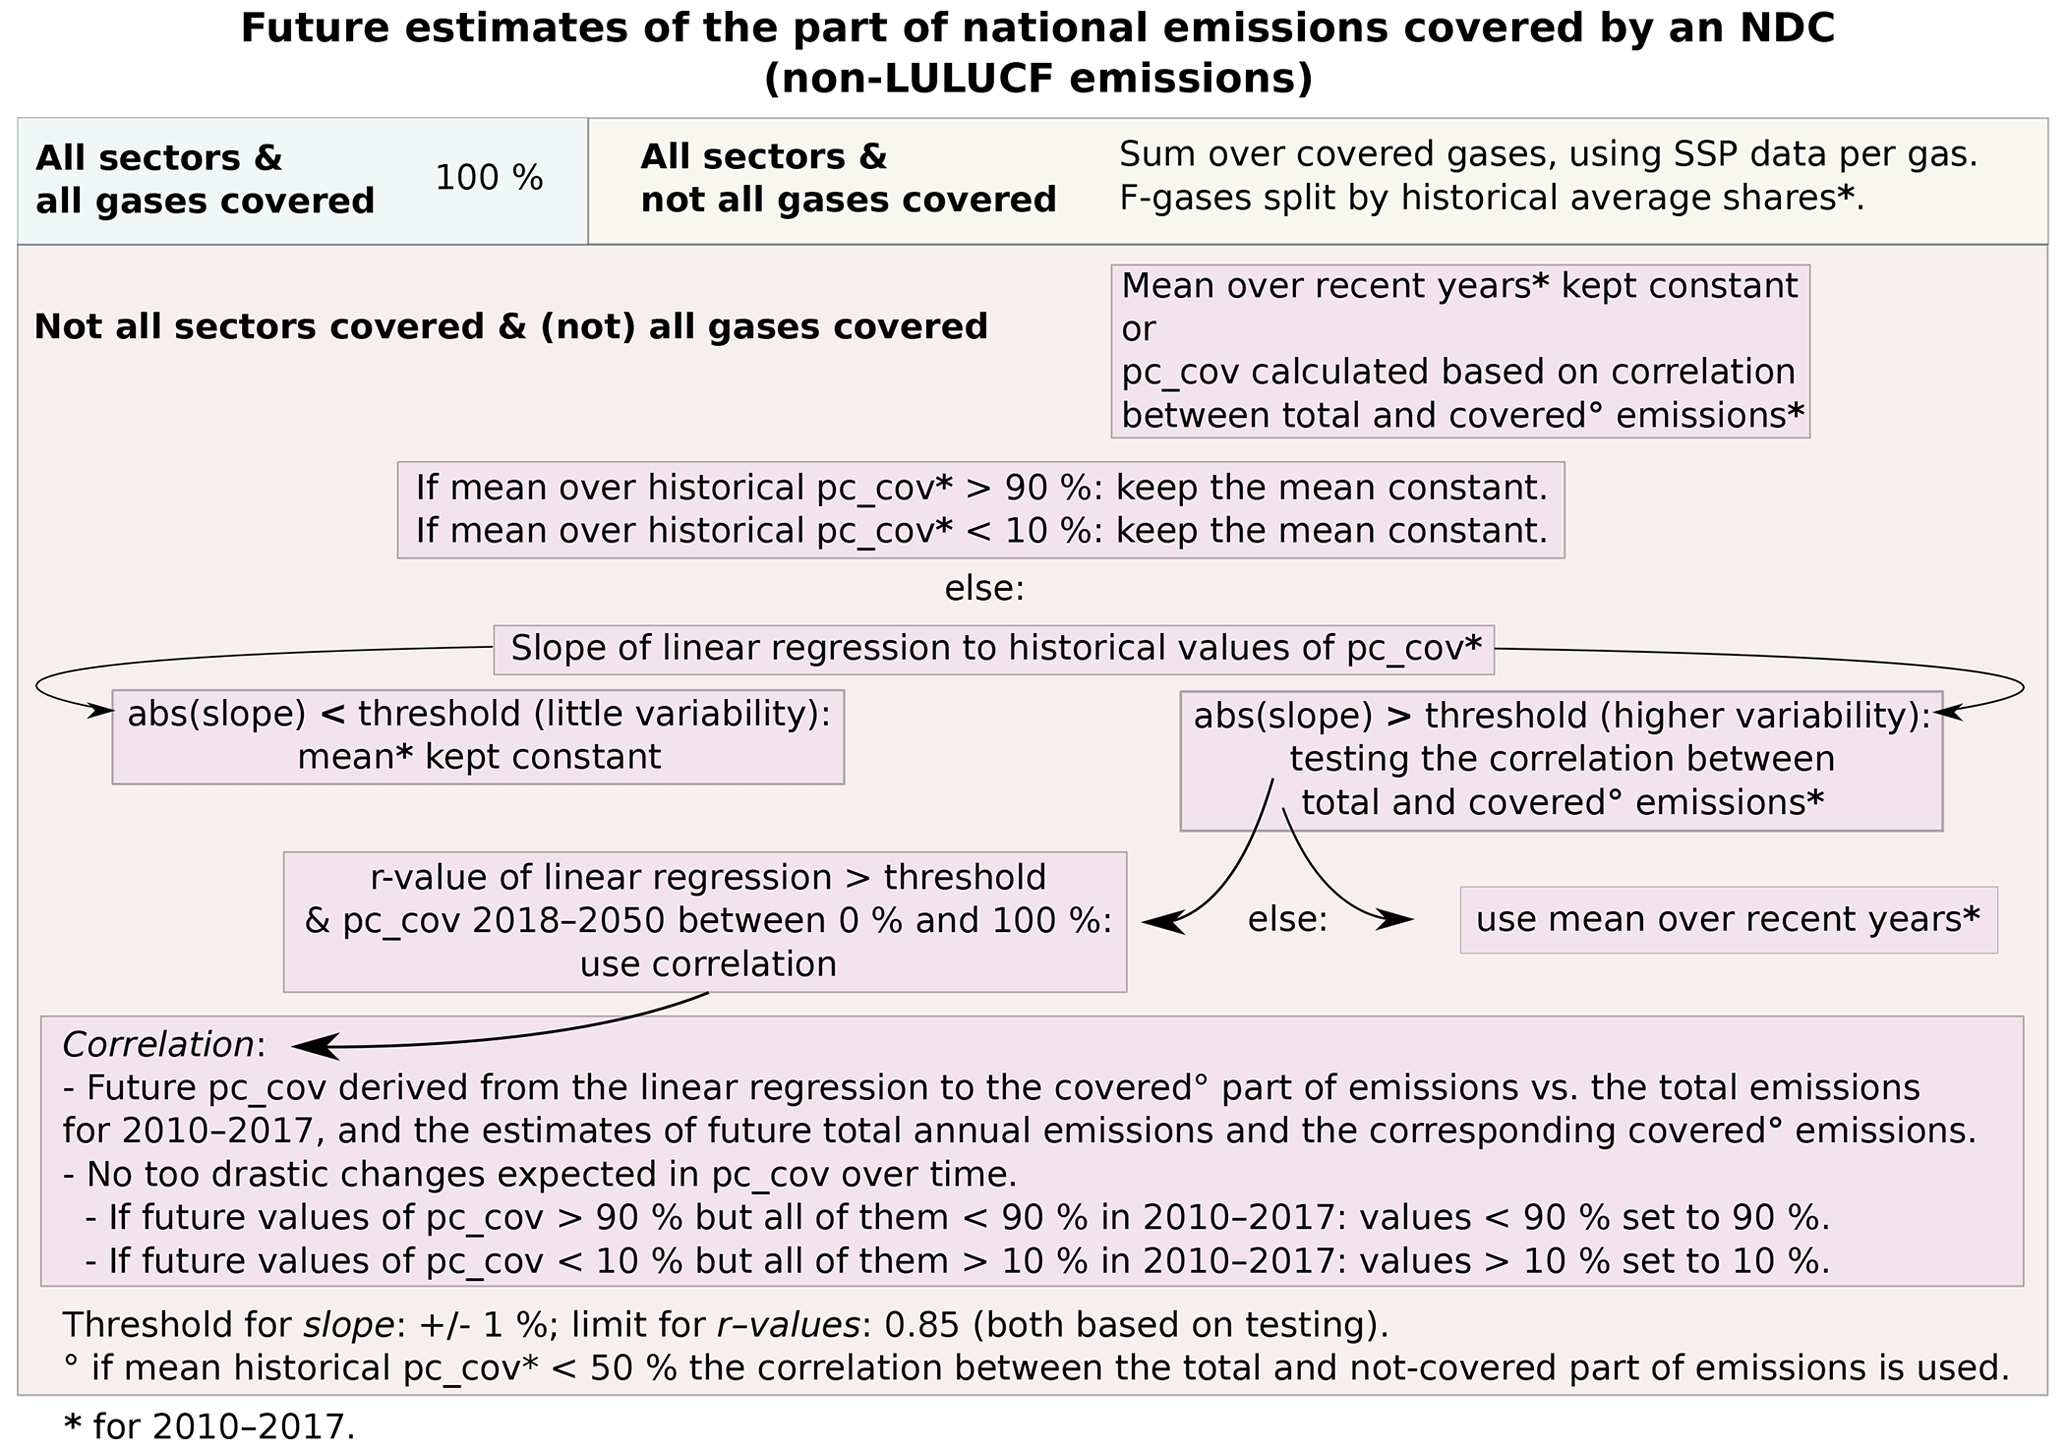
Figure A2Projections of the covered share of national emissions: scheme on decision making if the preference for the calculation of future values of %cov is set to “mean”, otherwise the correlation is used for all countries unless the r value of the regression line to the correlation is below 0.85.
Table A6Relative contribution of different gases and sectors to the national 2017 Kyoto GHG emissions (95th percentiles); 95th percentiles for the national shares of emissions from a certain gas and sector (e.g. energy emissions: in 95 %/5 % of the nations, energy emissions represent less/more than 91.5 % of national emissions). All values exclude emissions from LULUCF and bunker fuel emissions. All values are based on PRIMAP-hist v2.1 HISTCR emissions data (GWP AR4).
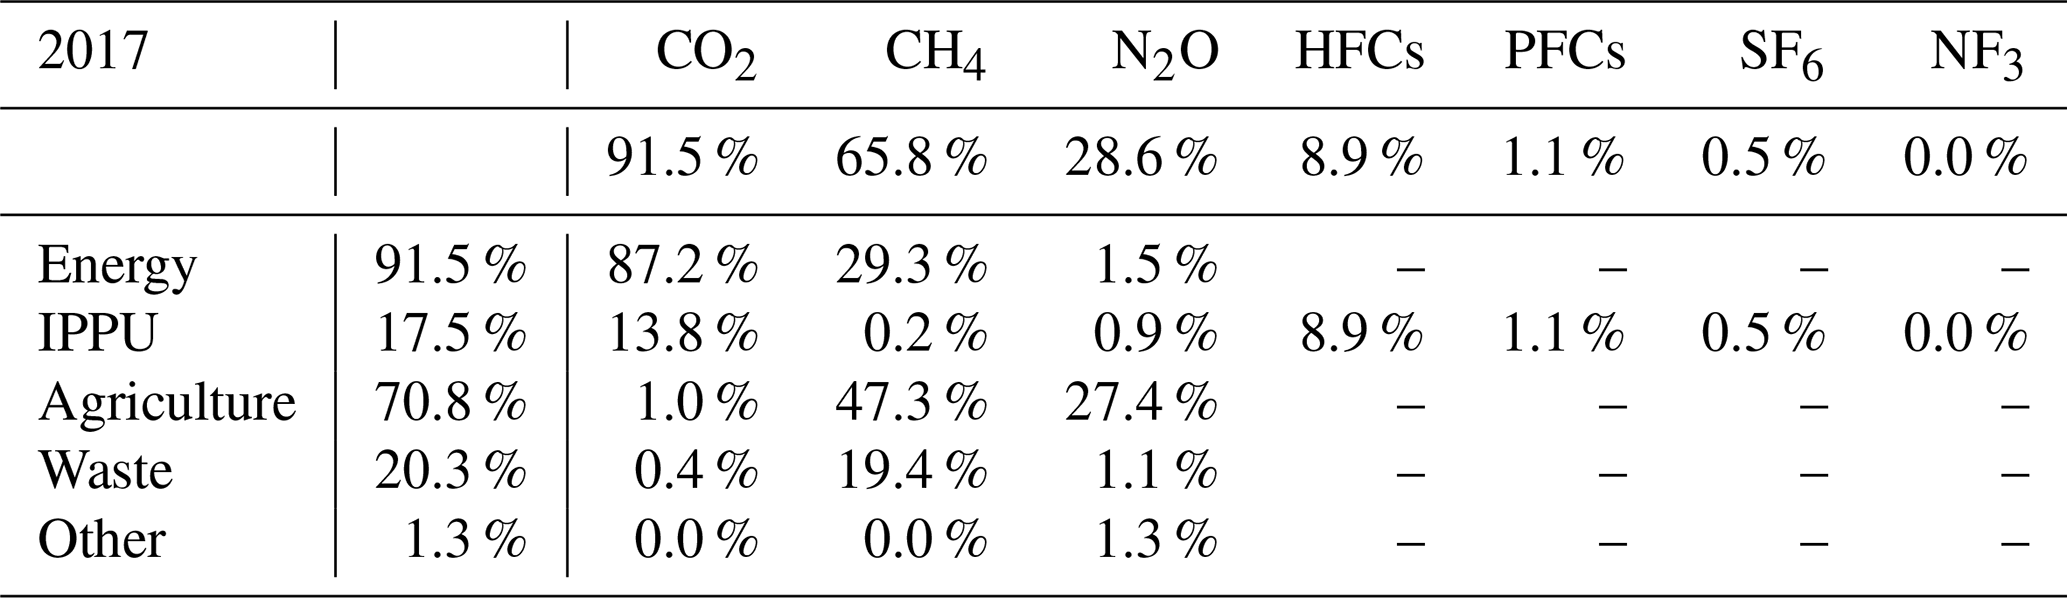
Table A7Absolute and relative contributions of different gases and sectors to the global 2017 Kyoto GHG emissions. All values exclude emissions from LULUCF and bunker fuel emissions. All values are based on PRIMAP-hist v2.1 HISTCR emissions data (GWP AR4). Global emissions per sector and gas (“Emissions”, in Gt CO2 eq.); remaining cells: global share per sector/gas (e.g. energy contributed 74.1 % to global 2017 emissions and energy CO2 67.3 %).
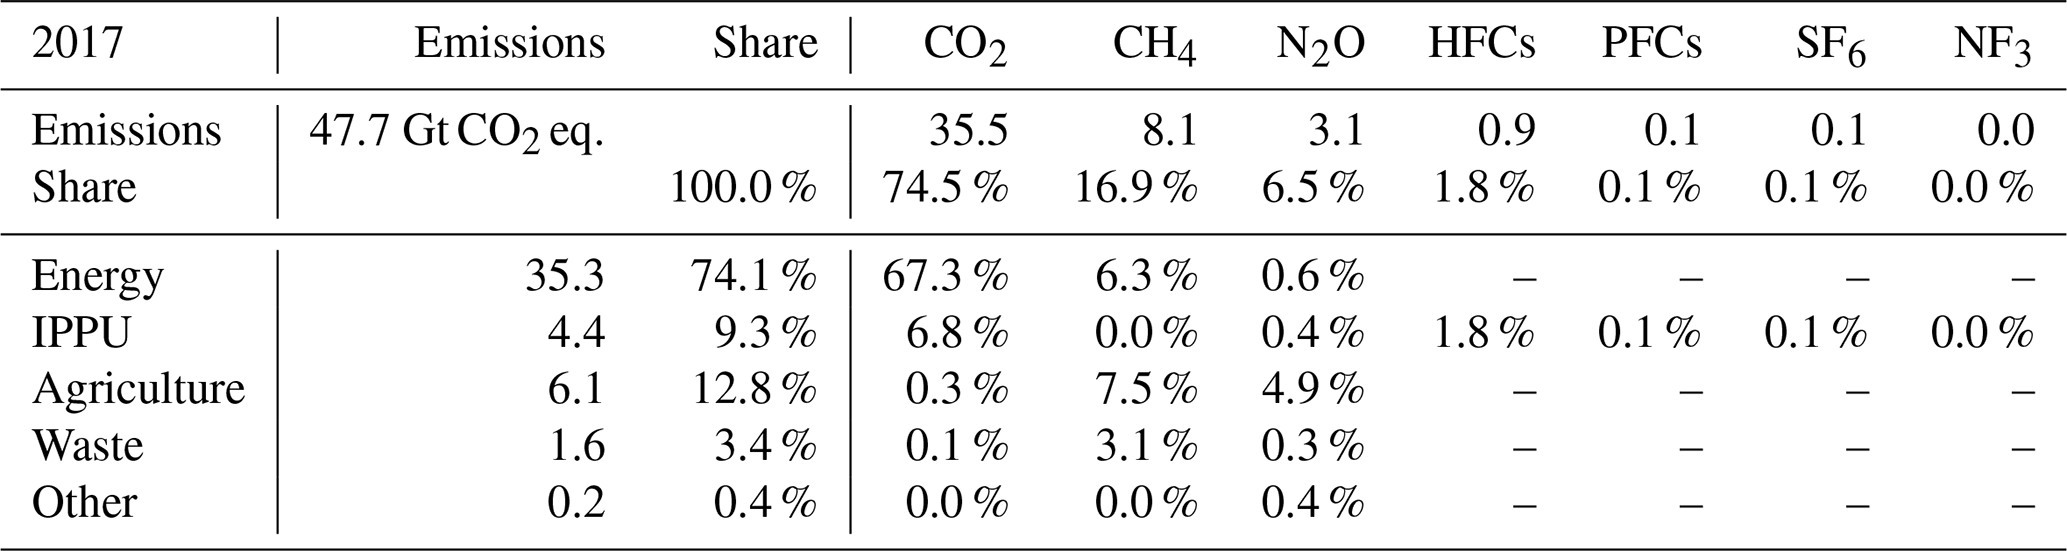
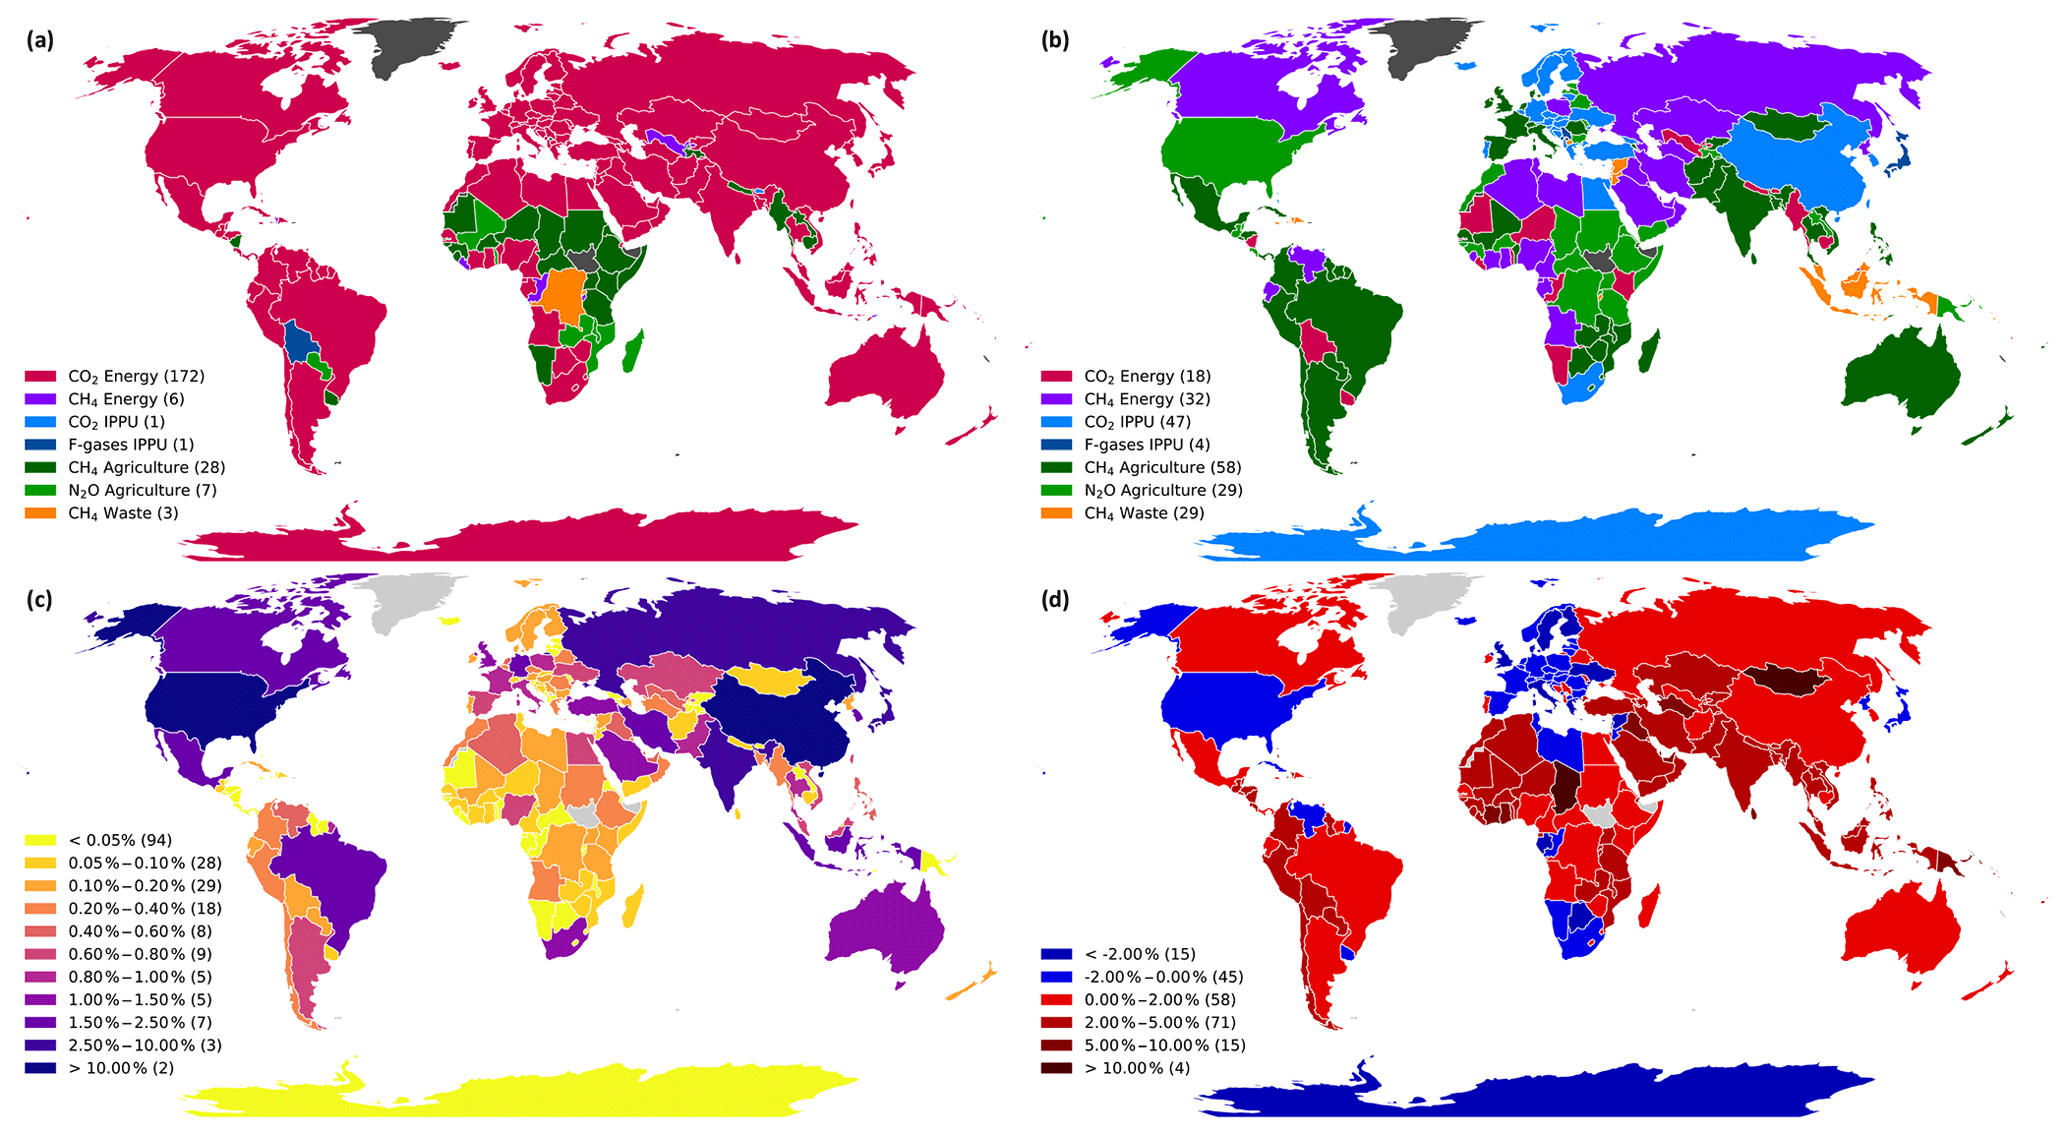
Figure A3(a, b) Highest and second highest contributing sectors plus gas combination on a national scale (2017 emissions). (c) Global share of national emissions for 2017 (non-linear colour scale). (d) Average emissions trend 2010–2017 in % yr−1 (based on linear regression to national emissions 2010–2017). All values are based on PRIMAP-hist v2.1 HISTCR emissions, following GWP AR4, and exclude emissions from LULUCF and bunker fuels.
A6 Options for the calculation of emissions pathways
Several options to modify the calculation of emissions pathways are implemented in the tool.
-
Targets only for countries X, Y, and Z. Use quantified targets for countries X, Y, and Z, otherwise use baseline emissions.
-
Prioritised target types. Use prioritised target types for countries X, Y, and Z with the target types being in the order A, B, and C, otherwise use type_reclass. type_main: use the “main target type” (what has been stated more or less in the NDC as a target type); type_reclass: use the reclassified target type (mostly ABS with the quantification based on data from the NDCs).
-
Countries without unconditional targets and what if the baseline is better than the conditional targets? Use the baseline emissions as unconditional pathways if no unconditional targets are available and the conditional worst pathway in 2030 is worse than the baseline emissions in 2030. Default: instead of the baseline, the conditional worst pathway is used as unconditional pathways as well.
-
Countries with targets above the baseline and whether to use the baseline in these cases. Use the baseline emissions instead of the mitigated pathway if in 2030 the mitigation value lies above the baseline. Checking unconditional/conditional best/worst pathways separately. Default: instead of the baseline, the constructed pathway is used.
-
Set coverage (exclLU) to 100 % for a set of countries or all countries.
-
Strengthen targets. Strengthen targets by a certain percentage P for countries X, Y, and Z either by adding P to the value given in a country's NDC or by multiplying the reduction by 100 % +P. If the resulting percentage is greater than 100 %, it is set to 100 %, which means a total reduction of the – covered share of – emissions. For example, for a target with 20 % reduction and P=10 %, if “add” is chosen, the result is , and if “multiply” is chosen, the result is . For absolute targets (ABS, AEI, ABU), one does not distinguish between add and multiply. In the case of ABS and AEI, the strengthened target is e.g. or 10 t CO2 eq. t CO2 eq., while in the case of ABU the calculation follows e.g.
−2 Mt CO2 eq. Mt CO2 eq. -
Use Climate Action Tracker estimates for countries X, Y, and Z if available. For chosen or all countries, use the CAT estimates if available (© 2020 Climate Action Tracker by Climate Analytics and NewClimate Institute with all rights reserved).
Table A8SSP narratives, mitigation, and adaptation challenges and IAMs for the marker scenarios.
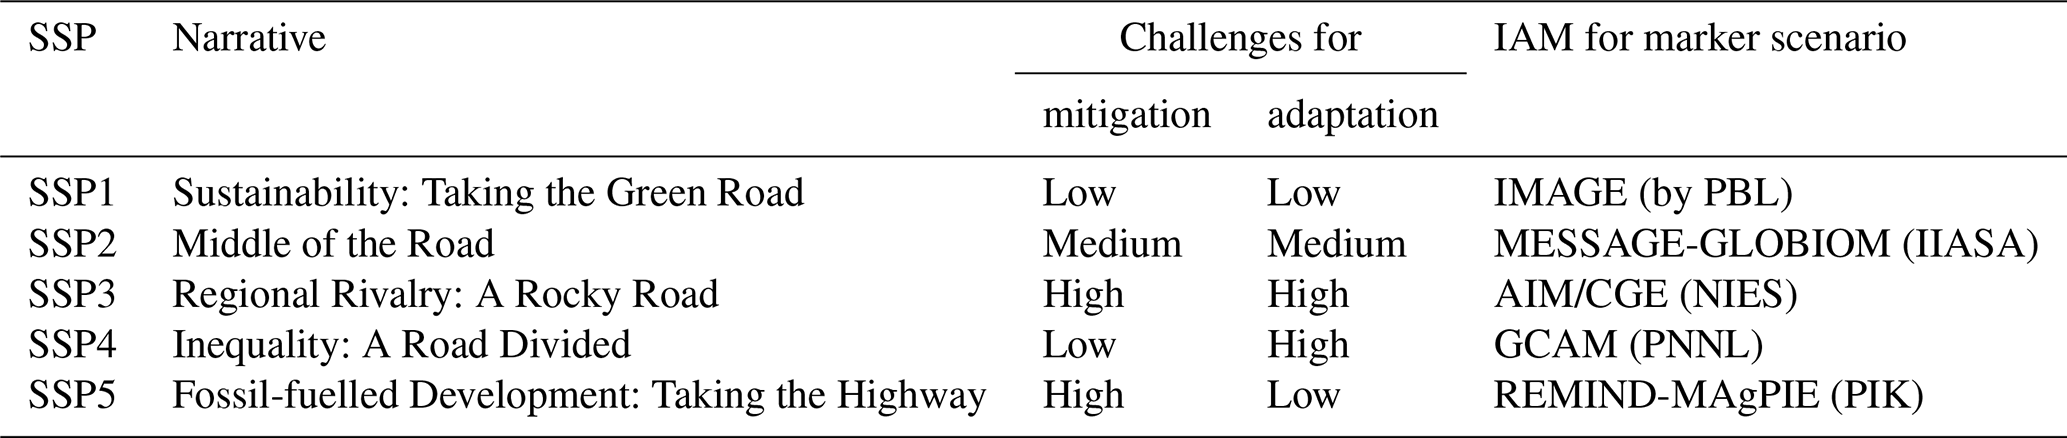
A7 Global and national emissions
Presented in a similar way to the assessment results for the covered share of emissions in Sect. 3.1 (Table 3, Fig. 6), this section gives the perspective in terms of sectoral and per-gas emissions for the year 2017 (Table A7, Fig. A3). Globally, the Energy sector was responsible for 74.1 % of emissions in 2017 (all shares in this section are for 2017 and excluding LULUCF and bunker fuels), and a total of 74.5 %/16.9 %/6.5 % was emitted in the form of CO2/CH4/N2O. F-gases and the IPPU sector, representing 2.0 % and 9.3 % of global emissions, are least covered by NDCs, while F-gases have long atmospheric lifetimes and very high GWPs (e.g. AR4 GWPs: HFCs 4–14 800, PFCs 7190–12 200). On a global scale, the Energy and IPPU sectors are dominated by CO2 emissions, while Agriculture and Waste are dominated by CH4 emissions. On the country level, shares vary, and in many African countries the highest emitting sector is Agriculture and the gas with the highest share of national emissions is CH4. Based on the available data for F-gases, they contributed 2.1 % to global emissions in 2017, with the majority of F-gases emitted in the form of HFCs (88.8 %), followed by SF6, PFCs, and NF3 (5.6 %, 5.3 %, and 0.4 %, respectively). Their shares can be underestimated, however, as especially for NF3, data are only available for a few countries. NF3 was included in the Kyoto GHG basket in 2012 only (Doha amendment to the Kyoto Protocol, UNFCCC, 2012).
A8 Shared socioeconomic pathways
For several target types (Sect. 2.1), quantifications rely on projected data, provided in the NDCs or from “external” sources, while to construct emissions pathways from national targets this is the case for most countries. Here, we use baseline projections from the shared socioeconomic pathways (Sect. 2.2.1). While for the quantification of national targets per-country data are needed, the SSP emissions pathways are generally only available for several world regions. The pathways were downscaled to the national level by Gütschow et al. (2021) using results from the “SSP GDP […] country model results as drivers for the downscaling process” (Gütschow et al., 2020b). From Gütschow et al. (2020b), we use the data with the source names PMSSPBIE and PMSSPBIEMISC and the scenarios named SSP1BLIMAGE, SSP2BLMESGB, SSP3BLAIMCGE, SSP4BLGCAM4, and SSP5BLREMMP (BL: baseline). These are SSP IAM scenarios (emissions and socioeconomic data) downscaled using “convergence downscaling with exponential convergence of emissions intensities and convergence before transition to negative emissions”, with bunker emissions having been removed before downscaling and data being harmonised and combined with PRIMAP-hist v2.1 time series. The emissions data are national values, excluding LULUCF and international bunker fuels, available for the gas baskets Kyoto GHG and F-gases (fluorinated greenhouse gases, consisting of HFCs, PFCs, SF6, and NF3) and for the individual gases CO2, CH4, and N2O. In terms of sectoral resolution, only national totals are available. As explained in Sect. A1, pre-processing of the downscaled SSPs is performed to fill some missing time series for countries with low emissions, population, or GDP. Additionally, for the estimation of %cov and as not all NDCs cover all F-gases, the time series of F-gases are split into the contributing component gases by assuming recent ratios of HFCs, PFCs, SF6, and NF3 (see Sect. A1).
A9 Emissions data from the NDCs vs. dmSSPs
Table A9 is an extended version of Table 4, in which we compare the NDCs' baseline emissions and the corresponding dmSSP2 emissions. Here, additionally included is information on all dmSSPs, the number of Parties from which we could extract emissions data from their NDC, and these countries' global emissions share (for dmSSP2).
Table A9Baseline emissions data provided in NDCs compared to our baseline emissions (separated into excluding and including emissions from LULUCF). For the base and target years of the assessed mitigation targets, all emissions data provided in the NDCs are aggregated (row “NDCs”) and compared to our baseline emissions (aggregate over the same countries; rows “dmSSP1–5” with the same values for 1990–2017). Baseline emissions: see Sect. 2.2 (PRIMAP-hist v2.1 1990–2017, dmSSPs, LULUCF emissions, all excluding bunker fuels). “Difference from dmSSP2”: how do the NDC values compare to the dmSSP2 baseline? “Number of Parties”: the number of Parties with emission data available. “Global share (dmSSP2)”: the global share of emissions for the countries with data available in a certain year compared to dmSSP2 (excluding bunker fuels). NDC emissions based on the GWP from SAR were converted to AR4 using national conversion factors. NDC submissions until 17 April 2020.
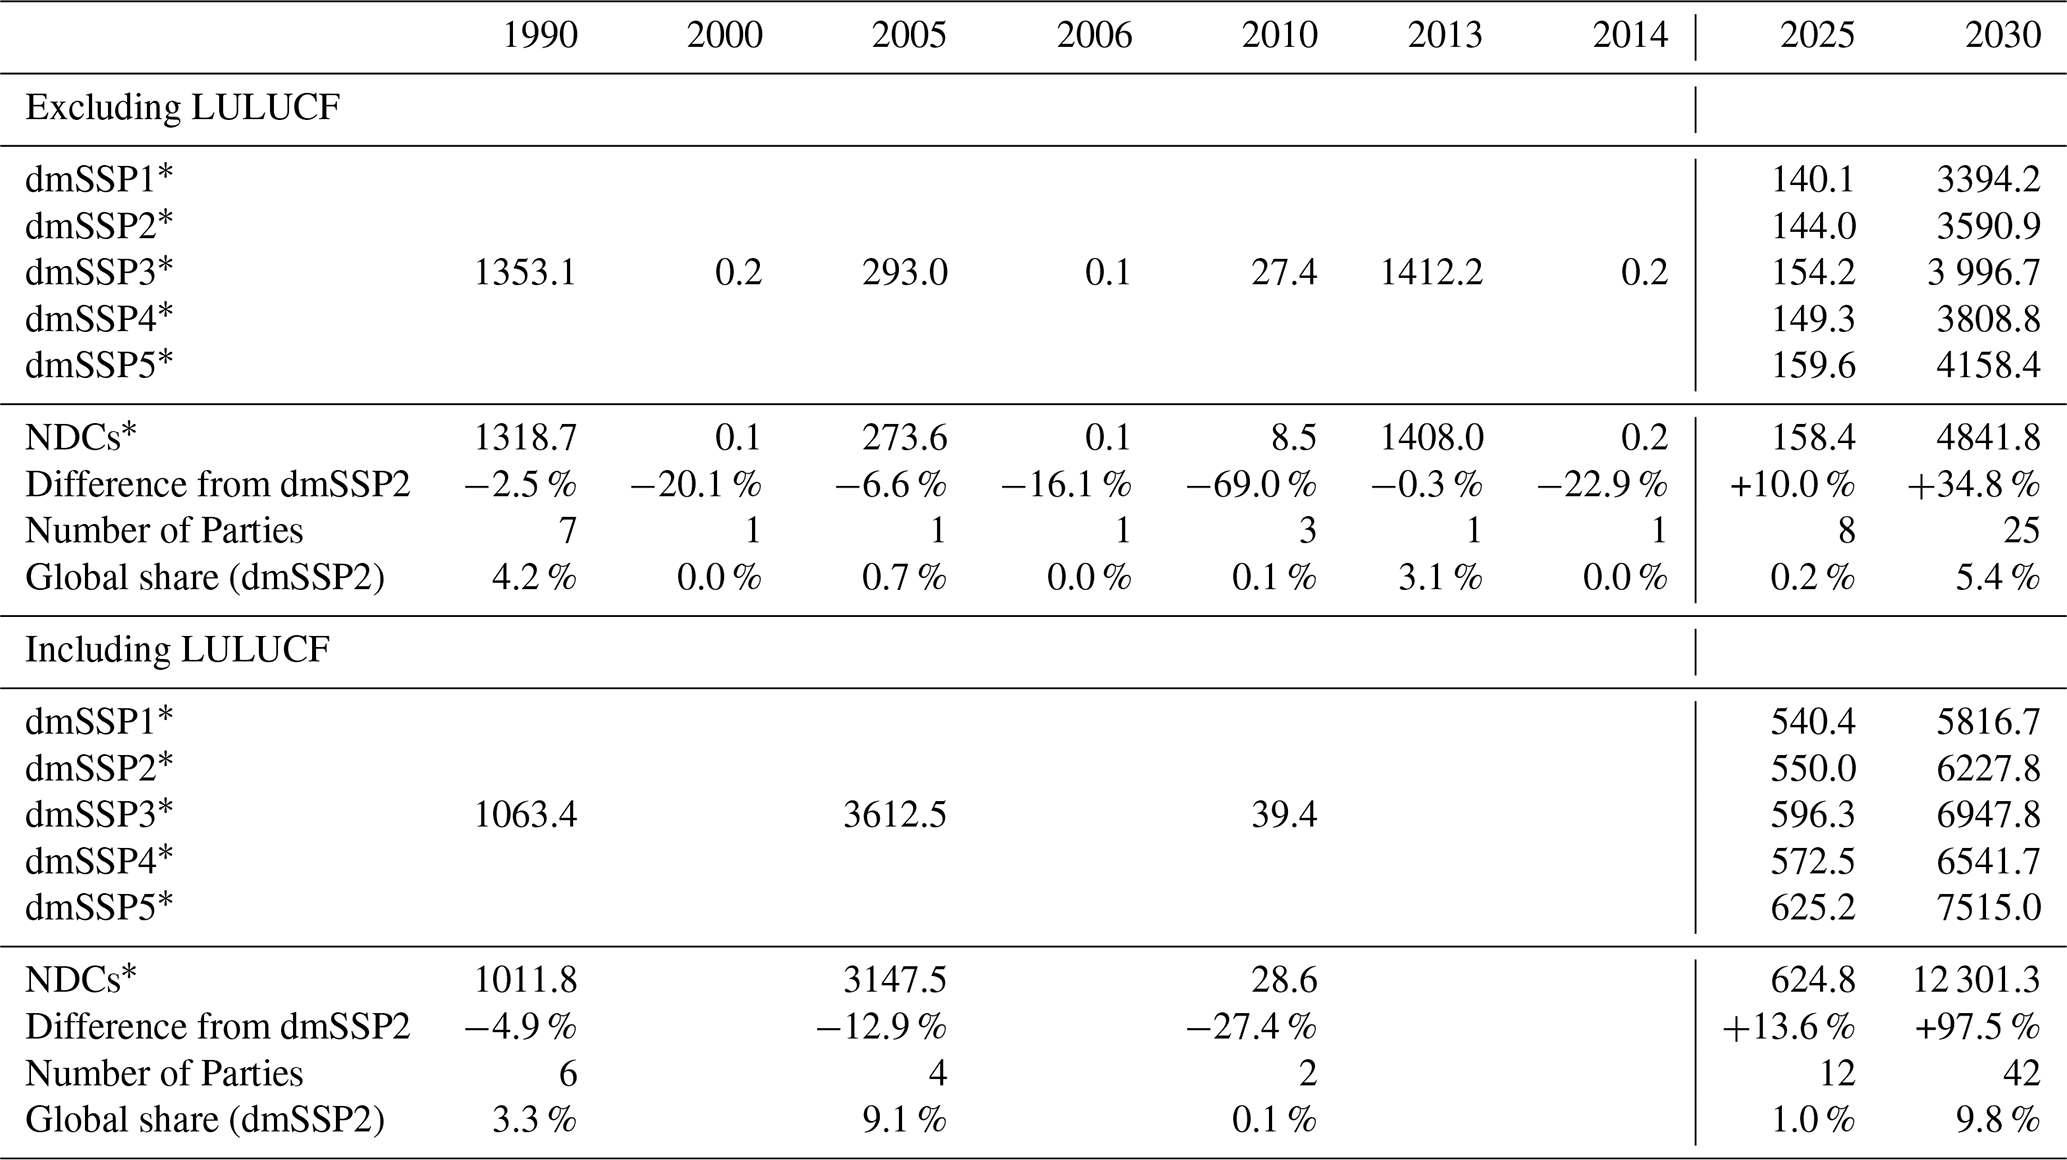
* Mt CO2 eq. AR4
All data sets we produced with NDCmitiQ for the presented paper and the code version NDCmitiQ v1.0.2 are available for download on Zenodo (https://doi.org/10.5281/zenodo.5113987, Günther et al., 2021).
For each quantification (about 1 min 20 s run time) one folder is provided, with the folder name structure being ndcs_yyyymmdd_hhss_, followed by these.
-
SSP1 to SSP5: which SSP marker scenario is chosen for the run. This information is also important if the run is based on NDC emissions data (type_reclass), as emissions data were not provided for all countries and the SSP baselines are used for the pathway construction.
-
typeReclass: runs with type_reclass, based on emissions data from the NDCs where possible.
-
typeMain: runs with type_main, based on external emissions data (PRIMAP-hist v2.1 HISTCR and downscaled SSP marker scenarios).
-
pccov100: runs with an assumed coverage of 100 %.
Without pccov100: coverage based on estimated %cov (Sect. 2.3). -
constEmiAfterLastTar: runs with assumed constant emissions after a Party's last target year.
Without constEmiAfterLastTar: instead of the emissions, the relative difference from the baseline is kept constant after the last target year. -
constDiffAfterLastTar: runs with assumed constant absolute difference from baseline emissions after a Party's last target year.
Without constDiffAfterLastTar: instead of the emissions, the relative difference from the baseline is kept constant after the last target year. -
BLForUCAboveBL: runs using the baseline emissions as the unconditional pathways for Parties without unconditional targets, even if the baseline is better than the conditional targets.
Without BLForUCAboveBL: conditional worst pathway is used in this case instead of the baseline. -
BLForTarAboveBL: runs using the baseline emissions if the mitigated pathway lies above the baseline in 2030.
Without BLForTarAboveBL: calculated mitigated pathway is used instead of the baseline. -
UNFCCC/FAO: runs using LULUCF data with UNFCCC or FAO chosen as the primary prioritised data source (UNFCCC, CRF, BUR, FAO or FAO, CRF, BUR, UNCFFF).
Without UNFCCC/FAO: prioritisation is CRF, BUR, UNFCCC, and FAO. -
CAT: runs using CAT quantifications for all countries with data available.
Without CAT: using NDCmitiQ.
Per run, the single per-country targets can be found in ndc_targets.csv, the country pathways are available in ndc_targets_pathways_per_country_used_for_ group_pathways.csv, and the aggregated pathways are stored in ndc_targets_pathways_per_group.csv.
Additionally, each of the folders contains the file log_file.m (information on the setup for the model run) and the sub-folder /per_country_info_on_target_calculations/ that provides per-country information on how exactly the national targets were quantified.
The time series that serve as input to the quantifications can be found in the folder (/data/preprocess/; see ) together with the estimated coverages.
Information on how to use NDCmitiQ is provided in the repository (README.md, requirements.txt, /docs/build/html/index.html).
The input that can easily be modified is time series of emissions (exclLU and onlyLU), %cov (exclLU), population, and GDP and information from the NDCs.
AG designed the study, implemented the module, carried out the analyses, and led the manuscript writing process. All the authors discussed the methodology and results and contributed to the presented paper.
The authors declare that they have no conflict of interest.
Publisher’s note: Copernicus Publications remains neutral with regard to jurisdictional claims in published maps and institutional affiliations.
Annika Günther and Johannes Gütschow are grateful for financial support by the German Federal Ministry for the Environment, Nature Conversation and Nuclear Safety, the German Ministry of Education and Research and the Open Access Fund of the Leibniz Association.
This research has been supported by the Bundesministerium für Umwelt, Naturschutz und nukleare Sicherheit (grant no. 16_II_148_GLobal_A_IMPACT) and the Bundesministerium für Bildung und Forschung (grant no. 01LS1711A).
This paper was edited by Tomomichi Kato and reviewed by Michel Den Elzen and one anonymous referee.
Bauer, N., Calvin, K., Emmerling, J., Fricko, O., Fujimori, S., Hilaire, J., Eom, J., Krey, V., Kriegler, E., Mouratiadou, I., de Boer, H. S., van den Berg, M., Carrara, S., Daioglou, V., Drouet, L., Edmonds, J. E., Gernaat, D., Havlik, P., Johnson, N., Klein, D., Kyle, P., Marangoni, G., Masui, T., Pietzcker, R. C., Strubegger, M., Wise, M., Riahi, K., and van Vuuren, D. P.: Shared Socio-Economic Pathways of the Energy Sector – Quantifying the Narratives, Global Environ. Change, 42, 316–330, https://doi.org/10.1016/j.gloenvcha.2016.07.006, 2017. a
Benveniste, H., Boucher, O., Guivarch, C., Treut, H. L., and Criqui, P.: Impacts of nationally determined contributions on 2030 global greenhouse gas emissions: uncertainty analysis and distribution of emissions, Environ. Res. Lett., 13, 014022, https://doi.org/10.1088/1748-9326/aaa0b9, 2018. a, b, c, d, e, f, g, h
Carey, E. V., Sala, A., Keane, R., and Callaway, R. M.: Are old forests underestimated as global carbon sinks?, Glob. Change Biol., 7, 339–344, https://doi.org/10.1046/j.1365-2486.2001.00418.x, 2001. a
CAT: Climate Action Tracker: Australia: Assumptions: Pledge, available at: https://climateactiontracker.org/countries/australia/assumptions/ (last access: 1 June 2020), 2019a. a
CAT: Climate Action Tracker: Brazil: Assumptions: NDC, https://climateactiontracker.org/countries/brazil/assumptions/ (last access: 1 June 2020), 2019b. a
CAT: Climate Action Tracker: India: Assumptions (update from 02 Dec 2019), available at: https://climateactiontracker.org/countries/india/assumptions/ (last access: 7 May 2020), 2019c. a
CAT: Climate Action Tracker: India (update from 02 Dec 2019), available at: https://climateactiontracker.org/countries/india/2019-12-02 (last access: 7 May 2020), 2019d. a, b, c, d
CAT: Climate Action Tracker: Temperatures: Addressing global warming, available at: https://climateactiontracker.org/global/temperatures/, last access: 5 June 2020a. a
CAT: Climate Action Tracker: China (update from 21 Sep 2020), available at: https://climateactiontracker.org/countries/china/2020-09-21 (last access: 15 March 2021), 2020b. a, b
CAT: Climate Action Tracker: Home, available at: https://climateactiontracker.org/, last access: 5 June 2020. a, b
Climate Equity Reference: Climate Equity Reference Calculator, available at: https://calculator.climateequityreference.org/ (last access: 1 June 2020), 2018. a
Climate Watch: Climate Watch: India, available at: https://www.climatewatchdata.org/countries/IND, last access: 7 May 2020a. a, b, c
Climate Watch: Climate Watch – Data for Climate Action, available at: https://www.climatewatchdata.org/, last access: 7 May 2020b. a
Crespo Cuaresma, J.: Income projections for climate change research: A framework based on human capital dynamics, Global Environ. Change, 42, 226–236, https://doi.org/10.1016/j.gloenvcha.2015.02.012, 2017. a
Dellink, R., Chateau, J., Lanzi, E., and Magné, B.: Long-term economic growth projections in the Shared Socioeconomic Pathways, Global Environ. Change, 42, 200–214, https://doi.org/10.1016/j.gloenvcha.2015.06.004, 2017. a
den Elzen, M., Kuramochi, T., Höhne, N., Cantzler, J., Esmeijer, K., Fekete, H., Fransen, T., Keramidas, K., Roelfsema, M., Sha, F., van Soest, H., and Vandyck, T.: Are the G20 economies making enough progress to meet their NDC targets?, Energy Policy, 126, 238–250, https://doi.org/10.1016/j.enpol.2018.11.027, 2019. a
FAO: FAOSTAT Database, available at: http://www.fao.org/faostat/en/#data, last access: 14 October 2019. a
Forsell, N., Turkovska, O., Gusti, M., Obersteiner, M., den Elzen, M., and Havlik, P.: Assessing the INDCs' land use, land use change, and forest emission projections, Carbon Balance and Management, 11, 26, https://doi.org/10.1186/s13021-016-0068-3, 2016. a
Fyson, C. L. and Jeffery, M. L.: Ambiguity in the Land Use Component of Mitigation Contributions Toward the Paris Agreement Goals, Earth's Future, 7, 873–891, https://doi.org/10.1029/2019EF001190, 2019. a, b, c, d, e, f, g, h, i, j
Geiges, A., Parra, P. Y., Fyson, C., Günther, A., Hare, B., Schaeffer, M., and Hutfilter, U. F.: How can Paris Agreement commitments be improved now to close the gap to 1.5∘C: Global long-term temperature outcomes of incremental versus transformational ambition scenarios for NDCs updates by 2020, available at: https://climateanalytics.org/media/ndc_closing_the_gap_to_1p5c.pdf (last access: 15 June 2020), 2019. a
Gombar, V.: India 'Walking the Walk' on Climate: Q&A, available at: https://about.bnef.com/blog/india-walking-the-walk-on-climate-qa/?utm_campaign=Carbon Brief Daily Briefing&utm_content=20201015&utm_medium=email&utm_source=Revue newsletter, last access: 14 October 2020. a
Graichen, J., Blank, D., Graichen, V., Harthan, R., and Herold, A.: Accounting of Nationally Determined Contributions: Guidance for the Establishment of an Accounting for NDCs for absolute or relative mitigation targets with a baseline, Deutsche Gesellschaft für Internationale Zusammenarbeit (GIZ) GmbH, available at: https://www.transparency-partnership.net/system/files/document/Guidance Accounting NDC_eng.pdf (last access: 3 May 2020), 2018. a
Günther, A., Gütschow, J., and Jeffery, M. L.: NDCmitiQ: a tool to quantify and analyse GHG mitigation targets (Version v1.0.2), Zenodo, https://doi.org/10.5281/zenodo.5113987, 2021. a
Gütschow, J.: The PRIMAP-Hist Socio-Eco Historical GDP and Population Time Series (1850–2017) (v2.1), GFZ Data Services, https://doi.org/10.5880/PIK.2019.019, 2019. a, b
Gütschow, J., Jeffery, M. L., Gieseke, R., Gebel, R., Stevens, D., Krapp, M., and Rocha, M.: The PRIMAP-hist national historical emissions time series, Earth Syst. Sci. Data, 8, 571–603, https://doi.org/10.5194/essd-8-571-2016, 2016. a, b, c
Gütschow, J., Jeffery, M. L., Schaeffer, M., and Hare, B.: Extending Near-Term Emissions Scenarios to Assess Warming Implications of Paris Agreement NDCs, Earth's Future, 6, 1242–1259, https://doi.org/10.1002/2017ef000781, 2018. a
Gütschow, J., Jeffery, L., Gieseke, R., and Günther, A.: The PRIMAP-hist national historical emissions time series (1850–2017), GFZ Data Services, https://doi.org/10.5880/PIK.2019.018, 2019. a, b, c, d, e, f, g
Gütschow, J., Jeffery, M. L., and Annika, G.: PRIMAP-crf: UNFCCC CRF data in IPCC categories (PRIMAP-crf-2019-v2), Zenodo, https://doi.org/10.5281/zenodo.3775575, 2020a. a
Gütschow, J., Jeffery, M. L., Günther, A., and Meinshausen, M.: Country Resolved Combined Emission and Socio-Economic Pathways Based on the RCP and SSP Scenarios – Dataset, Zenodo https://doi.org/10.5281/zenodo.3638137, 2020b. a, b, c, d
Gütschow, J., Jeffery, M. L., Günther, A., and Meinshausen, M.: Country-resolved combined emission and socio-economic pathways based on the Representative Concentration Pathway (RCP) and Shared Socio-Economic Pathway (SSP) scenarios, Earth Syst. Sci. Data, 13, 1005–1040, https://doi.org/10.5194/essd-13-1005-2021, 2021. a, b, c
Hargita, Y. and Rüter, S.: Analysis of the land use sector in INDCs of relevant Non-Annex I parties, available at: https://literatur.thuenen.de/digbib_extern/dn055903.pdf (last access: 1 February 2020), 2015. a
Hausfather, Z. and Peters, G. P.: RCP8.5 is a problematic scenario for near-term emissions, P. Natl. Acad. Sci. USA, 117, 27791–27792, https://doi.org/10.1073/pnas.2017124117, 2020. a
Hegerl, G. C., Zwiers, F. W., Braconnot, P., Gillett, N. P., Luo, Y., Orsini, J. A. M., Nicholls, N., Penner, J. E., and Scott, P. A.: Understanding and Attributing Climate Change, Cambridge University Press, Cambridge, UK, New York, NY, USA, 2007. a
IPCC: Climate Change: The 1990 and 1992 IPCC Assessments. IPCC First Assessment Report Overview and Policymaker Summaries and 1992 IPCC Supplement, IPCC, 1992. a, b
IPCC: Revised 1996 IPCC Guidelines for National Greenhouse Gas Inventories, IPCC/OECD/IEA, UK Meteorological Office, Bracknell, 1996. a, b
IPCC: 2006 IPCC Guidelines for National Greenhouse Gas Inventories, Prepared by the National Greenhouse Gas Inventories Programme, edited by: Eggleston, H. S., Buendia, L., Miwa, K., Ngara, T., and Tanabe, K., IGEST, Japan, 2006. a, b
IPCC: Contribution of Working Group I to the Fourth Assessment Report of the Intergovernmental Panel on Climate Change, Cambridge University Press, Cambridge, United Kingdom and New York, NY, USA, available at: https://www.ipcc.ch/report/ar4/wg1/ (last access: 21 July 2020), 2007. a
IPCC: Climate Change 2014: Synthesis Report. Contribution of Working Group I, II and III to the Fifth Assessment Report of the Interngovernmental Panel on Climate Change, IPCC, Geneva, Switzerland, available at: https://www.ipcc.ch/site/assets/uploads/2018/02/SYR_AR5_FINAL_full.pdf (last access: 27 February 2020), 2014. a, b
IPCC: Global warming of 1.5 ∘C. An IPCC Special Report on the impacts of global warming of 1.5 ∘C above pre-industrial levels and related global greenhouse gas emission pathways, in the context of strengthening the global response to the threat of climate change, sustainable development, and efforts to eradicate poverty, Interngovernmental Panel on Climate Change, 2018a. a, b
IPCC: Summary for Policymakers, in: Global warming of 1.5 ∘C, An IPCC Special Report on the impacts of global warming of 1.5 ∘C above pre-industrial levels and related global greenhouse gas emission pathways, in the context of strengthening the global response to the threat of climate change, sustainable development, and efforts to eradicate poverty, edited by: Masson-Delmotte, V., Zhai, P., Pörtner, H.-O., Roberts, D., Skea, J., Shukla, P. R., Pirani, A., Moufouma-Okia, W., Péan, C., Pidcock, R., Connors, S., Matthews, J. B. R., Chen, Y., Zhou, X., Gomis, M. I., Lonnoy, E., Maycock, T., Tignor, M., and Waterfield, T., Interngovernmental Panel on Climate Change, available at: https://www.ipcc.ch/sr15/chapter/spm/ (last access: 5 August 2020), 2018b. a
IPCC: Climate Change and Land: an IPCC special report on climate change, desertification, land degradation, sustainable land management, food security, and greenhouse gas fluxes in terrestrial ecosystems, Interngovernmental Panel on Climate Change, 2019a. a
IPCC: IPCC Special Report on the Ocean and Cryosphere in a Changing Climate, Interngovernmental Panel on Climate Change, 2019b. a
Jeffery, M. L., Gütschow, J., and Gieseke, R.: PRIMAP-CRF: UNFCCC CRF Data in IPCC 2006 Categories, GFZ Data Services, https://doi.org/10.5880/pik.2018.001, 2018a. a
Jeffery, M. L., Gütschow, J., Gieseke, R., and Gebel, R.: PRIMAP-crf: UNFCCC CRF data in IPCC 2006 categories, Earth Syst. Sci. Data, 10, 1427–1438, https://doi.org/10.5194/essd-10-1427-2018, 2018b. a
Köhl, M., Neupane, P. R., and Lotfiomran, N.: The impact of tree age on biomass growth and carbon accumulation capacity: A retrospective analysis using tree ring data of three tropical tree species grown in natural forests of Suriname, PLOS ONE, 12, e0181187, https://doi.org/10.1371/journal.pone.0181187, 2017. a
Leimbach, M., Kriegler, E., Roming, N., and Schwanitz, J.: Future growth patterns of world regions – A GDP scenario approach, Global Environ. Change, 42, 215–225, https://doi.org/10.1016/j.gloenvcha.2015.02.005, 2017. a
Meinshausen, M., Hare, B., Wigley, T. M. M., Vuuren, D. V., Elzen, M. G. J. D., and Swart, R.: Multi-gas Emissions Pathways to Meet Climate Targets, Clim. Change, 75, 151–194, https://doi.org/10.1007/s10584-005-9013-2, 2006. a
Meinshausen, M., Raper, S. C. B., and Wigley, T. M. L.: Emulating coupled atmosphere-ocean and carbon cycle models with a simpler model, MAGICC6 – Part 1: Model description and calibration, Atmos. Chem. Phys., 11, 1417–1456, https://doi.org/10.5194/acp-11-1417-2011, 2011. a
Myllyvirta, L. and Dahiya, S.: Analysis: India's CO2 emissions fall for first time in four decades amid coronavirus, available at: https://www.carbonbrief.org/analysis-indias-co2-emissions-fall-for-first-time-in-four-decades-amid -coronavirus?utm_campaign=RevueCBWeeklyBriefing &utm _medium=email&utm_source=Revue newsletter, last access: 12 May 2020. a
Nabel, J. E., Rogelj, J., Chen, C. M., Markmann, K., Gutzmann, D. J., and Meinshausen, M.: Decision support for international climate policy – The PRIMAP emission module, Environ. Model. Softw., 26, 1419–1433, https://doi.org/10.1016/j.envsoft.2011.08.004, 2011. a
Pauw, W. P., Cassanmagnano, D., Mbeva, K., Hein, J., Guarin, A., Brandi, C., Dzebo, A., Canales, N., Adams, K. M., Atteridge, A., Bock, T., Helms, J., Zalewski, A., Frommé, E., Lindener, A., and Muhammad, D.: NDC Explorer, https://doi.org/10.23661/ndc_explorer_2017_2.0, 2016. a
PIK: Paris Reality Check: PRIMAP-hist, available at: https://www.pik-potsdam.de/paris-reality-check/primap-hist/, last access: 5 October 2020. a
Pompeo, M. R.: On the U.S. Withdrawal from the Paris Agreement, available at: https://www.state.gov/on-the-u-s-withdrawal-from-the-paris-agreement/ (last access: 16 June 2020), 2019. a
Pugh, T. A. M., Lindeskog, M., Smith, B., Poulter, B., Arneth, A., Haverd, V., and Calle, L.: Role of forest regrowth in global carbon sink dynamics, P. Natl. Acad. Sci. USA, 116, 4382–4387, https://doi.org/10.1073/pnas.1810512116, 2019. a
Rahmstorf, S.: Anthropogenic Climate Change: Revisiting the Facts, Brookings Institution Press, Washington, 2008. a
Republic of India: India's Intended Nationally Determined Contribution: Working towards Climate Justice, available at: https://www4.unfccc.int/sites/ndcstaging/PublishedDocuments/India First/INDIA INDC TO UNFCCC.pdf (last access: 5 December 2019), 2016. a, b, c
Riahi, K., van Vuuren, D. P., Kriegler, E., Edmonds, J., O'Neill, B. C., Fujimori, S., Bauer, N., Calvin, K., Dellink, R., Fricko, O., Lutz, W., Popp, A., Cuaresma, J. C., KC, S., Leimbach, M., Jiang, L., Kram, T., Rao, S., Emmerling, J., Ebi, K., Hasegawa, T., Havlik, P., Humpenöder, F., Silva, L. A. D., Smith, S., Stehfest, E., Bosetti, V., Eom, J., Gernaat, D., Masui, T., Rogelj, J., Strefler, J., Drouet, L., Krey, V., Luderer, G., Harmsen, M., Takahashi, K., Baumstark, L., Doelman, J. C., Kainuma, M., Klimont, Z., Marangoni, G., Lotze-Campen, H., Obersteiner, M., Tabeau, A., and Tavoni, M.: The Shared Socioeconomic Pathways and their energy, land use, and greenhouse gas emissions implications: An overview, Global Environ. Change, 42, 153–168, https://doi.org/10.1016/j.gloenvcha.2016.05.009, 2017. a, b
Rocha, M. R., Krapp, M., Gütschow, J., Jeffery, M. L., Hare, B., and Schaeffer, M.: Historical Responsibility for Climate Change – from countries emissions to contribution to temperature increase, Climate Analytics, https://doi.org/10.13140/RG.2.2.31296.84481, 2015. a
Rogelj, J., den Elzen, M., Höhne, N., Fransen, T., Fekete, H., Winkler, H., Schaeffer, R., Sha, F., Riahi, K., and Meinshausen, M.: Paris Agreement climate proposals need a boost to keep warming well below 2 ∘C, Nature, 534, 631–639, https://doi.org/10.1038/nature18307, 2016. a
Rogelj, J., Fricko, O., Meinshausen, M., Krey, V., Zilliacus, J. J. J., and Riahi, K.: Understanding the origin of Paris Agreement emission uncertainties, Nature Commun., 8, 15748, https://doi.org/10.1038/ncomms15748, 2017. a, b, c
Roman-Cuesta, R. M., Herold, M., Rufino, M. C., Rosenstock, T. S., Houghton, R. A., Rossi, S., Butterbach-Bahl, K., Ogle, S., Poulter, B., Verchot, L., Martius, C., and de Bruin, S.: Multi-gas and multi-source comparisons of six land use emission datasets and AFOLU estimates in the Fifth Assessment Report, for the tropics for 2000–2005, Biogeosciences, 13, 5799–5819, https://doi.org/10.5194/bg-13-5799-2016, 2016. a
Smith, P., Bustamante, M., Ahammad, H., Clark, H., Dong, H., Elsiddig, E. A., Haberl, H., Harper, R., House, J., Jafari, M., Masera, O., Mbow, C., Ravindranath, N. H., Rice, C. W., Abad, C. R., Romanovskaya, A., Sperling, F., and Tubiello, F.: Agriculture, Forestry and Other Land Use (AFOLU), Cambridge University Press, Cambridge, UK, New York, NY, USA, 2014a. a
Smith, P., Bustamante, M., Ahammad, H., Clark, H., Dong, H., Elsiddig, E. A., Haberl, H., Harper, R., House, J., Jafari, M., Masera, O., Mbow, C., Ravindranath, N. H., Rice, C. W., Abad, C. R., Romanovskaya, A., Sperling, F., and Tubiello, F.: Agriculture, Forestry and Other Land Use (AFOLU), in: Climate Change 2014: Mitigation of Climate Change. Contribution of Working Group III to the Fifth Assessment Report of the Intergovernmental Panel on Climate Change, edited by: Edenhofer, O., Pichs-Madruga, R., Sokona, Y., Farahani, E., Kadner, S., Seyboth, K., Adler, A., Baum, I., Brunner, S., Eickemeier, P., Kriemann, B., Savolainen, J., Schlömer, S., von Stechow, C., Zwickel, T., and Minx, J. C., Cambridge University Press, Cambridge, UK, New York, NY, USA, available at: https://www.ipcc.ch/site/assets/uploads/2018/02/ipcc_wg3_ar5_chapter11.pdf (last access: 13 February 2020), 2014b. a
Stephenson, N. L., Das, A. J., Condit, R., Russo, S. E., Baker, P. J., Beckman, N. G., Coomes, D. A., Lines, E. R., Morris, W. K., Rüger, N., Álvarez, E., Blundo, C., Bunyavejchewin, S., Chuyong, G., Davies, S. J., Duque, Á., Ewango, C. N., Flores, O., Franklin, J. F., Grau, H. R., Hao, Z., Harmon, M. E., Hubbell, S. P., Kenfack, D., Lin, Y., Makana, J.-R., Malizia, A., Malizia, L. R., Pabst, R. J., Pongpattananurak, N., Su, S.-H., Sun, I.-F., Tan, S., Thomas, D., van Mantgem, P. J., Wang, X., Wiser, S. K., and Zavala, M. A.: Rate of tree carbon accumulation increases continuously with tree size, Nature, 507, 90–93, https://doi.org/10.1038/nature12914, 2014. a
Taibi, F.-Z. and Konrad, S.: Pocket Guide to NDCs under the UNFCCC, available at: https://pubs.iied.org/pdfs/G04320.pdf (last access: 22 September 2019), 2018. a
The World Bank: Nationally Determined Contributions (NDCs), available at: http://spappssecext.worldbank.org/sites/indc/Pages/mitigation.aspx (last access: 5 April 2020), 2016. a
Tubiello, F. N., Salvatore, M., Ferrara, A. F., House, J., Federici, S., Rossi, S., Biancalani, R., Golec, R. D. C., Jacobs, H., Flammini, A., Prosperi, P., Cardenas-Galindo, P., Schmidhuber, J., Sanchez, M. J. S., Srivastava, N., and Smith, P.: The Contribution of Agriculture, Forestry and other Land Use activities to Global Warming, 1990–2012, Glob. Change Biol., 21, 2655–2660, https://doi.org/10.1111/gcb.12865, 2015. a
UNFCCC: INDC Submission Pages, available at: https://www4.unfccc.int/sites/submissions/INDC/Submission Pages/submissions.aspx, last access: 1 May 2020a. a
UNFCCC: NDC Registry (interim), available at: https://www4.unfccc.int/sites/NDCStaging/Pages/All.aspx, last access: 1 May 2020b. a
UNFCCC: Glossary of climate change acronyms and terms, available at: https://unfccc.int/process-and-meetings/the-convention/glossary-of-climate-change-acronyms-and-terms#e, last access: 16 October 2020c. a
UNFCCC: Doha amendment to the Kyoto Protocol, Decision 1/CMP.8, available at: https://unfccc.int/files/kyoto_protocol/application/pdf/kp_doha_amendment_english.pdf (last access: 14 May 2020), 2012. a
UNFCCC: Adoption of the Paris Agreement, Decision 1/CP.21, available at: http://unfccc.int/resource/docs/2015/cop21/eng/l09r01.pdf (last access: 13 December 2019), 2015. a, b, c, d, e, f, g
UNFCCC: National Inventory Submissions 2018, available at: https://unfccc.int/process/transparency-and-reporting/reporting-and-review-under-the-convention/greenhouse-gas-inventories-annex-i-parties/national-inventory-submissions-2018 (last access: 23 July 2019), 2018. a
UNFCCC: UNFCCC Greenhouse Gas Inventory Data – Detailed Data by Party, available at: http://di.unfccc.int/detailed_data_by_party, last access: 23 July 2019a. a
UNFCCC: Submitted Biennial Update Reports (BURs) from Non-Annex I Parties, available at: https://unfccc.int/process/transparency-and-reporting/reporting-and-review-under-convention/biennial-update-reports-0 (last access: 23 Jnuary 2020), 2019b. a
UNFCCC: National Inventory Submissions 2019, available at: https://unfccc.int/process-and-meetings/transparency-and-reporting/reporting-and-review-under-the-convention/greenhouse-gas-inventories-annex-i-parties/national-inventory-submissions-2019, last access: 25 October 2019c. a
UNFCCC: Report of the Conference of the Parties serving as the meeting of the Parties to the Paris Agreement on the third part of its first session, held in Katowice from 2 to 15 December 2018. Addendum. Part two: Action taken by the Conference of the Parties serving as the meeting of the Parties to the Paris Agreement. Decisions adopted by the Conference of the Parties serving as the meeting of the Parties to the Paris Agreement, FCCC/PA/CMA/2018/3/Add.2, 2019d. a, b, c
United Nations Environment Programme: Emissions Gap Report 2019, UNEP, Nairobi, available at: https://wedocs.unep.org/bitstream/handle/20.500.11822/30797/EGR2019.pdf?sequence=1&isAllowed=y (last access: 17 April 2020), 2019. a, b, c, d, e
van Vuuren, D. P., Edmonds, J., Kainuma, M., Riahi, K., Thomson, A., Hibbard, K., Hurtt, G. C., Kram, T., Krey, V., Lamarque, J.-F., Masui, T., Meinshausen, M., Nakicenovic, N., Smith, S. J., and Rose, S. K.: The representative concentration pathways: an overview, Clim. Change, 109, 5–31, https://doi.org/10.1007/s10584-011-0148-z, 2011. a
World Resources Institute: NDC Partnership: Country Pages: India, available at: https://ndcpartnership.org/countries-map/country?iso=IND, last access: 1 May 2020. a, b, c
- Abstract
- Introduction
- NDCmitiQ: methodologies and background information
- NDCmitiQ: exemplary use cases
- Discussion
- Conclusions
- Appendix A: Additional information
- Code and data availability
- Author contributions
- Competing interests
- Disclaimer
- Acknowledgements
- Financial support
- Review statement
- References